Download
1 / 16
160 likes | 272 Views
4/2 Warm-up (1/3). Calculate this business’s profitability margins Gross Profit Margin Net Profit Margin. 4/2 Warm-up (2/3). Calculate this business’s profitability margins Gross Profit Margin Net Profit Margin. 4/2 Warm-up (3/3).

E N D
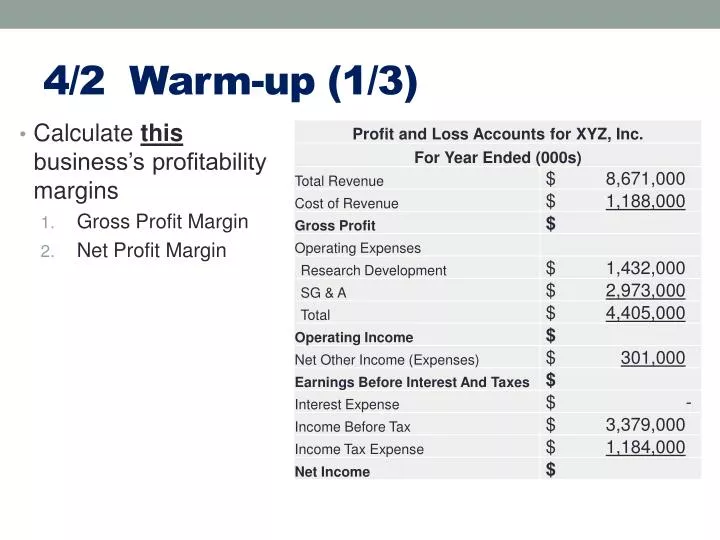
4/2 Warm-up (1/3) • Calculate thisbusiness’s profitability margins • Gross Profit Margin • Net Profit Margin
4/2 Warm-up (2/3) • Calculate this business’s profitability margins • Gross Profit Margin • Net Profit Margin
4/2 Warm-up (3/3) • Comment on the Profitability of the businesses (XYZ vs. ABC)
4/3 Warm-up • If a business is experiencing DECREASING profit margins, what can be said about the relationship between Revenue & Costs? • If a business is experiencing INCREASINGprofit margins, what can be said about the relationship between Revenue & Costs?
Microsoft’s Margins • Gross Profit Margin • 1996 = 86.3% • 2011 = 77.7% • Net Profit Margin • 1996 = 35.5% • 2011 = 38.8%
What’s Happening to Microsoft & Why? Marketing External Environment Strategy Operations Finance
Microsoft ArticleExplicit & Implicit • EXTERNALfactors impacting Microsoft • Competitors • External environment (PEST) • Microsoft STRATEGIES • Response to external factors • Microsoft MARKETING • Satisfying customer’s needs • Microsoft OPERATIONS • Resources & processes to satisfy customers. • Microsoft FINANCE • Working Capital • Capital Expenditures
4/4 Quiz • Identify where you can find the following information (Income Statement or Balance Sheet) • Total value of Equipment & Property • Total amount of Debt owed • Total amount of revenue generated • Total amount of Interest Paid • Total amount of Retained Profit • Total amount of Cash on hand • Total amount Owed by Customers (Debtors) • Total amount Owed to Suppliers (Trade Credit) • Total spent to make products sold • Total value of Stock (inventory) on hand • Total amount of capital invested by owners
Objective • Calculate financial ratios for a business using the Profit & Loss Account (Income Statement) and Balance Sheet • Interpret the financial performance of a business using Ratio Analysis • Analyze the impact of strategic decisions on the core functions of a business; • Marketing • Operations • Finance
Businesses • Amazon • AMR Corporation (American Airlines) • Apple • Boeing • Google • JC Penney • Nordstroms • Southwest Airlines • Starbucks
Purpose of Ratio Analysis • To analyze financial position • Liquidity situation? • Adequate amount of debt? • To assess performance • Revenue growing? • Costs under control? • Compare performance against projections • Aid stakeholders in their decision making
How To Use Financial Ratios Historical Comparisons Inter-firm Comparisons Compare similar business’s in the same industry Assess the firm’s relative performance • Look at firm’s ratios over time • Identify trends • Assess performance over time
Calculating Ratios • Revenue Growth • Profitability Ratios • Gross Profit Margin • Net Profit Margin • Liquidity Ratios • Current • Acid Test • Efficiency Ratios • Stock Turnover (# times, # days) • Return on Capital Employed • Debt Load (Risk) • Gearing (aka “Leverage”)
Group Warm-up • How can the Profitability Ratios be used to determine the % of revenue used for paying operating costs; • Cost of Revenue? • Expenses? GPM = Gross Profit Margin (Gross Profit / Revenue) NPM = Net Profit Margin (EBIT / Revenue)
Ratio Analysis Wrap-up • Work in your groups, discuss the financial performance of each company. • Rank the companies according to their investment potential & explain why. • Top = companies your group would invest in • Bottom = companies your group would not invest in • What other information would you consider before making an investment?