Download
1 / 1
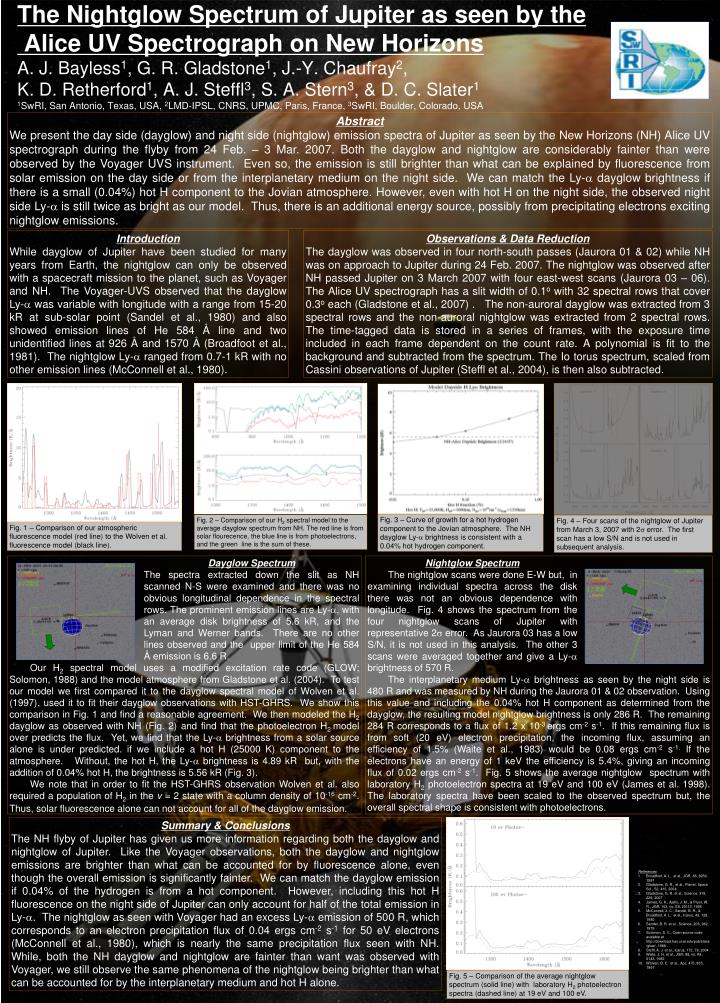
10 likes | 102 Views
Fig. 3 – Curve of growth for a hot hydrogen component to the Jovian atmosphere. The NH dayglow Ly- a brightness is consistent with a 0.04% hot hydrogen component. Fig. 1 – Comparison of our atmospheric fluorescence model (red line) to the Wolven et al. fluorescence model (black line).

E N D
Fig. 3 – Curve of growth for a hot hydrogen component to the Jovian atmosphere. The NH dayglow Ly-a brightness is consistent with a 0.04% hot hydrogen component. Fig. 1 – Comparison of our atmospheric fluorescence model (red line) to the Wolven et al. fluorescence model (black line). Fig. 4 – Four scans of the nightglow of Jupiter from March 3, 2007 with 2s error. The first scan has a low S/N and is not used in subsequent analysis. Fig. 2 – Comparison of our H2 spectral model to the average dayglow spectrum from NH. The red line is from solar flourecence, the blue line is from photoelectrons, and the green line is the sum of these. Fig. 5 – Comparison of the average nightglow spectrum (solid line) with laboratory H2 photoelectron spectra (dashed line) at 19 eV and 100 eV. Abstract We present the day side (dayglow) and night side (nightglow) emission spectra of Jupiter as seen by the New Horizons (NH) Alice UV spectrograph during the flyby from 24 Feb. – 3 Mar. 2007. Both the dayglow and nightglow are considerably fainter than were observed by the Voyager UVS instrument. Even so, the emission is still brighter than what can be explained by fluorescence from solar emission on the day side or from the interplanetary medium on the night side. We can match the Ly-a dayglow brightness if there is a small (0.04%) hot H component to the Jovian atmosphere. However, even with hot H on the night side, the observed night side Ly-a is still twice as bright as our model. Thus, there is an additional energy source, possibly from precipitating electrons exciting nightglow emissions. Introduction While dayglow of Jupiter have been studied for many years from Earth, the nightglow can only be observed with a spacecraft mission to the planet, such as Voyager and NH. The Voyager-UVS observed that the dayglow Ly-a was variable with longitude with a range from 15-20 kR at sub-solar point (Sandel et al., 1980) and also showed emission lines of He 584 Å line and two unidentified lines at 926 Å and 1570 Å (Broadfoot et al., 1981). The nightglow Ly-a ranged from 0.7-1 kR with no other emission lines (McConnell et al., 1980). Observations & Data Reduction The dayglow was observed in four north-south passes (Jaurora 01 & 02) while NH was on approach to Jupiter during 24 Feb. 2007. The nightglow was observed after NH passed Jupiter on 3 March 2007 with four east-west scans (Jaurora 03 – 06). The Alice UV spectrograph has a slit width of 0.1o with 32 spectral rows that cover 0.3o each (Gladstone et al., 2007) . The non-auroral dayglow was extracted from 3 spectral rows and the non-auroral nightglow was extracted from 2 spectral rows. The time-tagged data is stored in a series of frames, with the exposure time included in each frame dependent on the count rate. A polynomial is fit to the background and subtracted from the spectrum. The Io torus spectrum, scaled from Cassini observations of Jupiter (Steffl et al., 2004), is then also subtracted. The Nightglow Spectrum of Jupiter as seen by the Alice UV Spectrograph on New HorizonsA. J. Bayless1, G. R. Gladstone1, J.-Y. Chaufray2, K. D. Retherford1, A. J. Steffl3, S. A. Stern3, & D. C. Slater11SwRI, San Antonio, Texas, USA, 2LMD-IPSL, CNRS, UPMC, Paris, France, 3SwRI, Boulder, Colorado, USA Our H2 spectral model uses a modified excitation rate code (GLOW; Solomon, 1988) and the model atmosphere from Gladstone et al. (2004). To test our model we first compared it to the dayglow spectral model of Wolven et al. (1997), used it to fit their dayglow observations with HST-GHRS. We show this comparison in Fig. 1 and find a reasonable agreement. We then modeled the H2 dayglow as observed with NH (Fig. 2) and find that the photoelectron H2 model over predicts the flux. Yet, we find that the Ly-a brightness from a solar source alone is under predicted. if we include a hot H (25000 K) component to the atmosphere. Without, the hot H, the Ly-a brightness is 4.89 kR but, with the addition of 0.04% hot H, the brightness is 5.56 kR (Fig. 3). We note that in order to fit the HST-GHRS observation Wolven et al. also required a population of H2 in the v = 2 state with a column density of 10-16 cm-2. Thus, solar fluorescence alone can not account for all of the dayglow emission. Dayglow Spectrum The spectra extracted down the slit as NH scanned N-S were examined and there was no obvious longitudinal dependence in the spectral rows. The prominent emission lines are Ly-a, with an average disk brightness of 5.6 kR, and the Lyman and Werner bands. There are no other lines observed and the upper limit of the He 584 Å emission is 6.6 R. The interplanetary medium Ly-a brightness as seen by the night side is 480 R and was measured by NH during the Jaurora 01 & 02 observation. Using this value and including the 0.04% hot H component as determined from the dayglow, the resulting model nightglow brightness is only 286 R. The remaining 284 R corresponds to a flux of 1.2 x 10⁻³ ergs cm-2 s-1. If this remaining flux is from soft (20 eV) electron precipitation, the incoming flux, assuming an efficiency of 1.5% (Waite et al., 1983) would be 0.08 ergs cm-2 s-1. If the electrons have an energy of 1 keV the efficiency is 5.4%, giving an incoming flux of 0.02 ergs cm-2 s-1. Fig. 5 shows the average nightglow spectrum with laboratory H2 photoelectron spectra at 19 eV and 100 eV (James et al. 1998). The laboratory spectra have been scaled to the observed spectrum but, the overall spectral shape is consistent with photoelectrons. Nightglow Spectrum The nightglow scans were done E-W but, in examining individual spectra across the disk there was not an obvious dependence with longitude. Fig. 4 shows the spectrum from the four nightglow scans of Jupiter with representative 2s error. As Jaurora 03 has a low S/N, it is not used in this analysis. The other 3 scans were averaged together and give a Ly-a brightness of 570 R. Summary & Conclusions The NH flyby of Jupiter has given us more information regarding both the dayglow and nightglow of Jupiter. Like the Voyager observations, both the dayglow and nightglow emissions are brighter than what can be accounted for by fluorescence alone, even though the overall emission is significantly fainter. We can match the dayglow emission if 0.04% of the hydrogen is from a hot component. However, including this hot H fluorescence on the night side of Jupiter can only account for half of the total emission in Ly-a. The nightglow as seen with Voyager had an excess Ly-a emission of 500 R, which corresponds to an electron precipitation flux of 0.04 ergs cm-2 s-1 for 50 eV electrons (McConnell et al., 1980), which is nearly the same precipitation flux seen with NH. While, both the NH dayglow and nightglow are fainter than want was observed with Voyager, we still observe the same phenomena of the nightglow being brighter than what can be accounted for by the interplanetary medium and hot H alone. • References • Broadfoot, A. L. et al., JGR, 86, 8259, 1981 • Gladstone, G. R., et al., Planet. Space Sci., 52, 415, 2004. • Gladstone, G. R. et al., Science, 318, 229, 2007 • James, G. K., Ajello, J. M., & Pryor, W. R., JGR, 103, no, E9, 20113, 1998 • McConnell, J. C., Sandel, B. R., & Broadfoot, A. L. et al., Icarus, 43, 128, 1980 • Sandel, B. R. et al., Science, 206, 962, 1979 • Solomon, S. C., Open source code avalable at http://download.hao.ucar.edu/pub/stans/glow/, 1988.. • Steffl, A. J. et al., Icarus, 172, 78, 2004 • Waite, J. H. et al., JGR, 88, no. A8, 6143, 1983 • Wolven, B. C. et al., ApJ, 475, 835, 1997