Download
1 / 62
1.44k likes | 4.42k Views
Hemodynamic Monitoring. By Nancy Jenkins RN,MSN. What is Hemodynamic Monitoring and why do it?. It is measuring the pressures in the heart It allows us to see inside the heart and adjust volume as needed. Comparing Hemodynamics to IV pump. Fluid =preload

E N D
Hemodynamic Monitoring By Nancy Jenkins RN,MSN
What is Hemodynamic Monitoring and why do it? It is measuring the pressures in the heart It allows us to see inside the heart and adjust volume as needed
Comparing Hemodynamics to IV pump • Fluid =preload • Pump= CO or contractility (needs electricity) • Tubing =afterload
Nursing ManagementHemodynamic Monitoring- You are already doing • General appearance • Level of consciousness • Skin color/temperature • Vital signs • Peripheral pulses • Urine output • Lung sounds
Nursing ManagementHemodynamic Monitoring • **Single hemodynamic values are rarely significant. • Monitor trends and evaluate whole clinical picture • Goals • Recognize early clues • Intervene before problems develop or escalate
Hemodynamic Monitoring Components We Will Look at Today Heart Rate Blood Pressure and MAP CVP Pulmonary Artery Pressures Systemic Vascular Pressure (SVR) Pulmonary Vascular Pressure (PVR) Cardiac Output/ Cardiac Index Stroke Volume
Hemodynamic MonitoringGeneral Principles • CO: Volume of blood pumped by heart in 1 minute • CI: CO adjusted for body size • SV: Volume ejected with each heartbeat • SVI: SV adjusted for body size • Easier to adjust HR than SV **Preload, afterload, and contractility determine SV
Hemodynamics: Normal value Mean Arterial Pressure (MAP)70 -90 mm Hg Cardiac Index (CI)- 2.2-4.0 L/min/m2 Cardiac Output (CO)- 4-8 L/min Central Venous Pressure (CVP) (also known asRightAtrial Pressure (RA))2-8 mmHg Pulmonary Artery Pressure (PA) Systolic 20-30 mmHg (PAS)Diastolic 4-12 mmHg (PAD)Mean 15-25 mmHg Pulmonary Capillary Wedge Pressure (PWCP) 4-12 mmHg Systemic Vascular Resistance(SVR) 800-1200
Volume of blood within ventricle at end of diastole • **Measured by CVP and wedge pressure in ICU
Preload • Def- the volume that stretches the LV just before contraction • Measured by CVP for RV and PAWP for LV • Measures the preload of the LV or LVEDP= wedge or PAW • **The greater the preload the greater the stroke volume and the greater the cardiac output
Decreased Preload- leads to Dec. SV and venous return • Hypovolemia • Tachycardia- why? • Vasodilation/ dec. venous return • Treatment- fluid • **A goal for heart failure
Increased Preload • Valvular disease • Hypervolemia • Heart failure • Treatment- diuretics, vasodilators • **Vascular system holding tank- vasodilation, vasoconstriction depending on need
Afterload • Resistance to ejection- arterial B/P • Measured by PVR and SVR in the ER • Decreased afterload • Vasodilation (sepsis, hyperthermia) • Hypotention • Nitrates
Afterload • Increased afterload • Vasoconstriction (hypovolemia, hypothermia) • Aortic stenosis • Hypertension • Fight or flight • Pulmonary hypertension • **The greater the afterload, the lower the cardiac output
Cardiac Output • CO=SVxHR; CI= CO/BSA • Normal CO 4-8 L/min; CI 2.2-4 • Urine output- indirect measurement • To compensate for dec. CO get tachycardia • Decreased CO • Poor ventricular filling- hypovolemia or SVT • Poor emptying, dec. contractility (infarct, ischemia, arrhythmias) • Vasodilation- sepsis and drugs • Increased afterload- hypertension, vasoconstriction
Cardiac Output • Increased • Increased O2 demand- exercise • SNS • Drugs- positive inotropics (Continuous infusions: Dobutamine, Dopamine, Primacor • Digoxin- IVP
Stroke Volume • Def- amount of blood ejected with each heart beat • Normal SV= 60-130 • Exercise can increase SV • Factors that determine SV • Preload • Afterload • Contractility
Contractility • Starling’s law • Increased contractility • SNS • Drugs- positive inotropics, epinephrine, calcium • Decreased contractility • Loss of muscle (acute MI, cardiomyopathy) • Hypoxemia • Electrolyte imbalance • Drugs- (lidocaine, calcium channel blockers, beta blockers
Contractility • Determined by the SV and the EF% • **Important to know the EF% of all heart failure patients • Measured by echo • EF- how much blood is ejected during systole compared to how much preload there is. • **Normal EF%- 55-65% • Ex 90/140= 64%EF
How and when do we measure afterload?Arterial B/P and SVR • Continuous arterial pressure monitoring • Acute hypertension/hypotension • Respiratory failure- frequent ABG sampling • Shock • Coronary interventional procedures • Continuous infusion of vasoactive drugs
Best indicator of tissue perfusion. Needs to be at least 60-70 to perfuse organs
Arterial Pressure Monitoring • High- and low-pressure alarms based on patient’s status • Risks • Hemorrhage, infection, thrombus formation, neurovascular impairment, loss of limb • Nursing- Check 5 P’s
Arterial Pressure Waveform Dicrotic notch signifies the closure of the aortic valve.
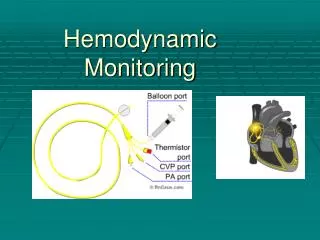
Pulmonary Artery Catheter Fig. 66-7 PA Catheter Insertion
PPA catheter tells you everything you want to know about the heart: (Snap, Crackle, Pop) - 1) how well the pump is pumping (cardiac output, cardiac index) (snap) - 2)how full the right side of the heart is (CVP), and how full the left side is (wedgepressure) – that’s the volume…(crackle) 3) and how well your patient’s arteries can squeeze : that’s the SVR – the “systemic vascular resistance”… (pop)
PA Waveforms during Insertion Fig. 66-9
Important Measurements Obtained by PA Catheter • Right Atrial Pressure (CVP) • PAP • Diastolic (PAD) • PA Systolic (PAS) • PA Wedge (Wedge, PAOP) • Cardiac Output • Cardiac Index
Pulmonary Artery Pressure Monitoring- CVP • Right atrium port- also know as proximal • Measurement of CVP • Injection of fluid for CO measurement • Can you give meds through this port? • Blood sampling
Central Venous Pressure Waveforms Fig. 66-11
CVP valuesRight Heart Presssures • Normal 2-8mmHg • Dec. • Hypovolemia • Decreased venous return • Inc. • Hypervolemia • Inc. venous return • Right HF, pulmonary hypertension • Tricuspid stenosis and regurgitation
PA pressure • PAD- should be close to wedge • PAS- tells RV pressure • PAW- LVEDP or preload of LV
PA Pressures • Normal 20-30 mmHg systolic, 4-12mmHg diastolic • PAS= RV pressure • Inc PAS in pulmonary hypertension • Inc. PAD in ventricular failure • Dec. in hypovolemia • Dec. in shock
PAW • Normal 6-12mmHg • Equals LVEDP or preload of LV • Dec.in hypovolemia or low stroke volume • Inc. in LV failure, mitral valve disorders • Inc. in hypervolemia • *** Fluids for dec. wedge and diuretics for inc. wedge
Measuring Cardiac Output Fig. 66-12