Download
1 / 10
100 likes | 202 Views
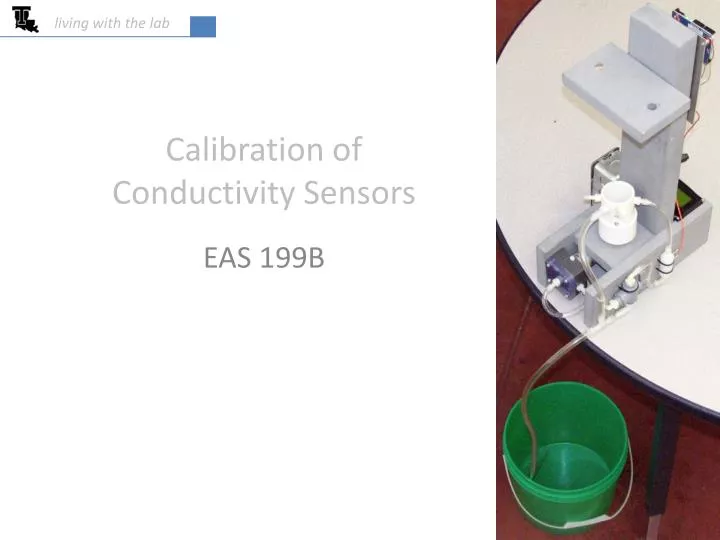
living with the lab. Calibration of Conductivity Sensors. EAS 199B. living with the lab. Calibration. Associate sensor output with salt concentration Relate sensor output and salt concentration using an equation (linear regression)

E N D
living with the lab Calibration of Conductivity Sensors EAS 199B
living with the lab Calibration • Associate sensor output with salt concentration • Relate sensor output and salt concentration using an equation (linear regression) • The goal is to be able to compute the salt concentration based on sensor output cal ∙ i ∙ brate [kal-uh-breyt] -verb (used with object), -brat ∙ ed, -brat ∙ ing. 1. to determine, check, or rectify the graduation of (any instrument giving quantitative measurements).
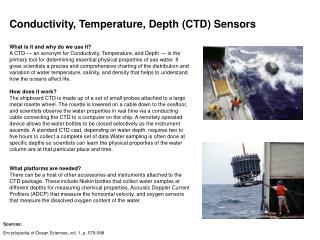
5V H2O OH- Cl- Cl- e- e- Na+ Cl- Na+ Cl- Na+ Na+ Cl- Na+ Cl- Na+ Na+ Cl- Na+ Cl- Na+ Cl- Na+ Na+ Cl- Cl2 Cl Cl- Cl- Cl OH- H H2O H Na+ living with the lab e- e- Na+ is a spectator ion e- 10 kΩ e- The Basic Idea e- • Adding salt to the water will increase the availability of Cl- ions at the anode • More ions at the anode will increase the rate at which chemical reactions can occur • The “electrical resistance” of the salt water will decrease as more salt is added to the water • The analog voltage on the + side of the 10kΩ resistor will increase as more salt is added • Correlating this voltage with the salt concentration will allow us to “calibrate” the conductivity sensor e- ion migration anode – oxidation(loss of electrons) cathode – reduction(gain of electrons)
living with the lab The Circuit and Sketch intsalinity_power_pin = 4; // Digital I/O pin, Global variable void setup() { Serial.begin(9600); pinMode(power_pin, OUTPUT); } void loop() { int salinity_input_pin = 2; // Analog input pin int salinity; salinity = salinity_reading( salinity_power_pin, salinity_input_pin ); Serial.println(salinity); } // --------------------------------------------------- int salinity_reading( int power_pin, int input_pin ) { int reading; digitalWrite( power_pin, HIGH ); // Turn on the sensor delay(10); // Wait to settle reading = analogRead( input_pin ); // Read voltage digitalWrite( power_pin, LOW ); // Turn off the sensor return reading; }
living with the lab Salt Concentrations • Each group of students should put about 1.5 inches of water in four bottles • The four bottles should contain . . . • DI water • 0.05% weight NaCl • 0.10% weight NaCl • 0.15% weight NaCl • Please take ONLY the amount that you will need to use TODAY • Be sure to label your water bottles • Swish a small amount of DI water around in your bottle to wash out impurities before filling with calibration water
living with the lab Capture data during calibration
living with the lab Calibration steps in the lab • Configure your flow loop as required for homework • Implement the conductivity sensor circuit on your breadboard • Flush tank with DI water. • Pour enough DI water into your fishtank to fill the flow loop • Turn on the pump to run the flow loop for about a minute to “wash out” the impurities. • Turn the three-way valve toward the drain to flush the system • Repeat to completely clean the system • Fill the system with DI water • Collect calibration data • Wait for the system to come into equilibrium • Copy a large (50 to 100) readings from the Serial Monitor to a text file or Excel • Save the file with a name that allows you to identify it later • Fill the system with 0.05 wt% salt water. Flush once, and refill with 0.05 wt% salt water • Repeat steps 5a through 5c • Repeat steps 5 through 7 for 0.10 wt% salt water and 0.15 wt% salt water
living with the lab Analysis of calibration data Use MATLAB to create a histogram of your data Compute the mean, standard deviation and median of the data Record the data in the following table
living with the lab Steps • Configure your flow loop as required for homework • Implement the conductivity sensor circuit on your breadboard • Flush tank with DI water. • Pour enough DI water into your fishtank to fill the flow loop • Turn on the pump to run the flow loop for about a minute to “wash out” the impurities. • Turn the three-way valve toward the drain to flush the system • Repeat to completely clean the system • Fill the system with DI water • Collect calibration data for DI water • Fill the system with 0.05 wt% salt water. Flush once, and refill with 0.05 wt% salt water • Collect calibration data for 0.05wt% salt water • Repeat steps 6 and 7 for 0.10 wt% salt water and 0.15 wt% salt water collect this data
living with the lab Fit Output of Sensor to Salt Concentration