Download
1 / 24
330 likes | 729 Views
DESIGN OF EXPERIMENTS. Purposeful changes of the inputs (factors) to a process in order to observe corresponding changes in the output (response). Inputs. Outputs. Process. Douglas Montgomery, Design and Analysis of Experiments. Why use DOE ?.

E N D
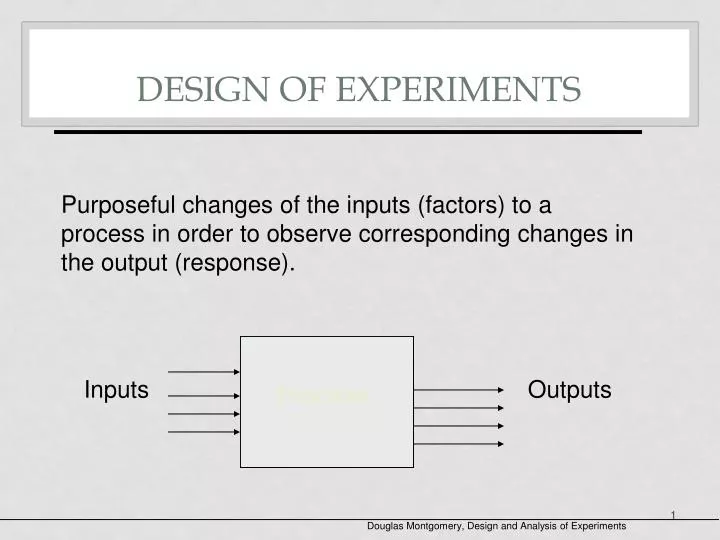
DESIGN OF EXPERIMENTS Purposeful changes of the inputs (factors) to a process in order to observe corresponding changes in the output (response). Inputs Outputs Process Douglas Montgomery, Design and Analysis of Experiments
Why use DOE ? • A basis of action -- allows purposeful changes. • An analytic study -- one in which action will be taken on a cause-and-effect system to improve performance of a product or process in the future. • Follows the scientific approach to problem solving. • Provides a way to measure natural variation. • Permits the clear analysis of complex effects. • Most efficient way to derive the required information at the least expenditure of resources. Moen, Nolan and Provost, Improving Quality Through Planned Experimentation
Interactions Varying factors together vs. one at a time. + B U C K - - + D O E George Box, Do Interactions Really Matter, Quality Engineering, 1990.
+ B U C K - - D O E Voila! + George Box, Do Interactions Really Matter, Quality Engineering, 1990.
Experiment run at SKF -- largest producer of rolling bearing in the world. • Looked at three factors: heat treatment, outer ring osculation and cage design. • Results: • choice of cage design did not matter (contrary to previously accepted folklore -- considerable savings) • life of bearing increased five fold if osculation and heat treatment are increased together -- saved millions of dollars ! George Box, Do Interactions Really Matter, Quality Engineering, 1990.
Bearings like this have been made for decades. Why did it take so long to discover this improvement ? One factor vs. interaction effects ! 16 128 26 85 Heat 19 21 Cage 17 25 Osculation George Box, Do Interactions Really Matter, Quality Engineering, 1990.
The Power of Interactions ! 21 106 Heat 23 18 Osculation George Box, Do Interactions Really Matter, Quality Engineering, 1990.
2 2 Design Example Consider an investigation into the effect of the concentration of the reactant and the amount of catalyst on the reaction time of a chemical process. L H reactant (factor A) 15% 25% catalyst (factor B) 1 bag 2 bags Douglas Montgomery, Design and Analysis of Experiments
Design Matrix for 22 A B AB Total Average - - + + - - - + - + + + Main effects Interaction
Replicates I II III Total Factor A - B - 28 25 27 80 Settings A + B - 36 32 32 100 A - B + 18 19 23 60 A + B + 31 30 29 90 Douglas Montgomery, Design and Analysis of Experiments
An effect is the difference in the average response at one level of the factor versus the other level of the factor. A effect = ( [90 + 100] - [60 + 80] ) / 2(3) = 8.33 60 90 100 80 - + A Douglas Montgomery, Design and Analysis of Experiments
A B AB Total Average - - + 80 26.7 + - - 100 33.3 - + - 60 20 + + + 90 30 Avg + 31.7 Avg - 23.3 Effect 8.4 Use a matrix to find the effects of each factor, including the interaction effect between the two factors. Douglas Montgomery, Design and Analysis of Experiments
A B AB Total Average - - + 80 26.7 + - - 100 33.3 - + - 60 20 + + + 90 30 Completing the matrix with the effect calculations: Avg + 31.7 25 28.3 Avg - 23.3 30 26.7 Effect 8.4 -5 1.7 Douglas Montgomery, Design and Analysis of Experiments
B AB A -10 -5 0 5 10 Dot Diagram Douglas Montgomery, Design and Analysis of Experiments
35 30 25 20 - + A Response Plots 35 30 25 20 - + B Douglas Montgomery, Design and Analysis of Experiments
Interaction Response Plot 35 30 25 20 B - B + B - B + - + A A - A + 26.7 20 33.3 30 Douglas Montgomery, Design and Analysis of Experiments
Prediction Equation The ‘intercept’ in the equation is the overall average of all observations. The coefficients of the factors in the model are 1/2 the effect. Y = 27.5 + 8.33/2 A - 5/2 B + 1.7/2 AB or Y = 27.5 + 4.165 A - 2.5 B + 0.85 AB note: A and B will be values between -1 and +1.
Source of Sum of Degrees of Mean F Variation Squares Freedom Square Analysis of Variance A 208.33 1 208.33 53.15 * B 75.00 1 75.33 19.13 * AB 8.33 1 8.33 2.13 Error 31.34 8 3.92 Total 323.00 11 * = significant at 1% (see F table)
Source of Sum of Degrees of Mean F Variation Squares Freedom Square Calculating SS, df and MS for Effects and Interactions A 208.33 1 208.33 53.15 * always 1 for this type design SS / df SS = Effect 2 x n = 8.332 x 3 where n = replicates Use this same process for A, B and AB
Source of Sum of Degrees of Mean F Variation Squares Freedom Square Calculating total sum of squares and total degrees of freedom Total 323.00 11 Total df = n - 1 = 12 - 1 = 11 This is found by adding up every squared observation and then subtracting what is called a correction factor (sum of all observations, square this amount, then divide by the number of observations). SST = 282 + 252 + 272 + ... + 292 - (3302 / 12) = 9398.0 - 9075.0 = 323.0
Source of Sum of Degrees of Mean F Variation Squares Freedom Square Calculating error sum of squares, df and mean square Error 31.34 8 3.92 Found by subtraction: Total SS - SSA - SSB - SSAB = 323 - 208.33 - 75.0 - 8.33 = 31.34 SS / df Found by subtraction: = Total df - A df - B df - AB df = 11 - 1 - 1 - 1 = 8
Source of Sum of Degrees of Mean F Variation Squares Freedom Square Calculating F ratios A 208.33 53.15 * B 75.33 19.13 * AB 8.33 2.13 Error 3.92 208.33 / 3.92 75.33 / 3.92 8.33 / 3.92 F ratios: F = MS (A or B or AB) ------------------------- MS (error) Compare to F table
Interpreting F ratios F table at num df = 1 and denom df = 8 F .25 1.54 F .10 3.46 F .05 5.32 F .025 7.57 F .01 11.26 • F ratios confirm that factors A and B are significant at the 1% level. • F ratio shows there is not a significant interaction.
Why use 2k designs ? • Easy to use and data analysis can be performed using graphical methods. • Relatively few runs required. • 2k designs have been found to meet the majority of the experimental needs of those involved in the improvement of quality. • 2k designs are easy to use in sequential experimentation. • Fractions of the 2k (fractional factorials) can be used to further reduce the experiment size. Moen, Nolan and Provost, Improving Quality Through Planned Experimentation