Download
1 / 64
890 likes | 1.65k Views
Signalized Intersection. Uninterrupted Flow Section. Interrupted Flow Section. Chapter 9 Capacity and Level of Service for Highway Segments. Definitions and Concepts. Types of Facilities Facilities may generally be classified into one of two categories:. Signalized Intersection.

E N D
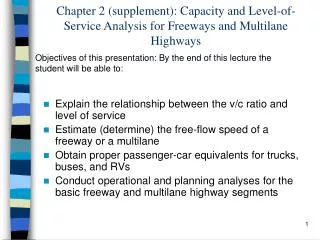
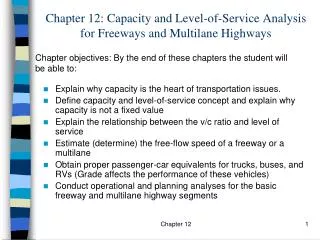
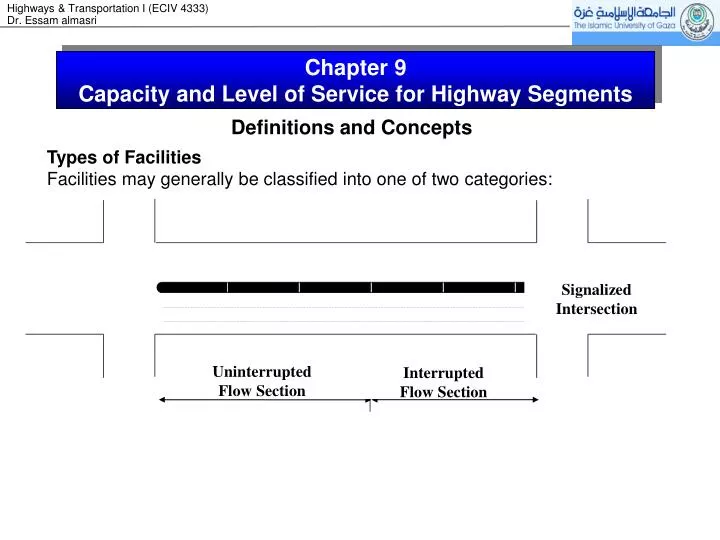
Signalized Intersection Uninterrupted Flow Section Interrupted Flow Section Chapter 9 Capacity and Level of Service for Highway Segments Definitions and Concepts Types of Facilities Facilities may generally be classified into one of two categories:
Signalized Intersection Uninterrupted Flow Section Interrupted Flow Section Definitions and Concepts Uninterrupted Flow Facilities They have no fixed elements, such as traffic signals and stop signs, that cause interruption to traffic flow. Examples of Uninterrupted flow facilities are freeway two-lane highway and multilane highway. Interrupted Flow Facilities They have fixed elements causing periodic interruption to traffic flow. Examples of interrupted flow facilities are signalised intersections, Unsignalized intersections (stop or yield controlled approach), and arterial.
Definitions and Concepts Level of Service Level of service is a qualitative measure that describes operational conditions within a traffic stream and their perception by drivers or/ and passengers. These conditions are in terms of such factors as speed and travel time, traffic interruption, comfort and convenience, and safety. Six LOS’s are defined for each type of facilities. They are given letter A to F, with LOS A representing the best operating conditions and LOS F the worst.
Definitions and Concepts Level of Service Level B: the lower limit of which is often used for the design of rural highways, is the zone of stable flow with more marked restriction Level A: Represents free flow at low concentration with no restriction due to traffic conditions.
Definitions and Concepts Level of Service Level C: denote the zone of stable flow with more marked restriction on the driver’s selection of speed and with reduced ability to pass. Level D: reflect little freedom for driver maneuverability.
Definitions and Concepts Level of Service Level E: Low operating speeds and volumes near or at capacity, which the area is of unstable flow. Level F: provided by the familiar traffic jam with frequent interruptions and breakdown of flow
Definitions and Concepts Capacity In general, the capacity of a facility is defined as the maximum hourly rate at which persons or vehicles can be reasonably expected to traverse a point during a given time period under prevailing roadway, traffic and control conditions. • Prevailing road conditions: • Physical features that cause reductions in traffic flow • Narrow traffic lanes • Inadequate shoulders • Side obstructions (poles, bridges, retaining wall) • Parked cars close to edge of the carriageway • Imperfect horizontal or vertical curvature • The layout of intersection on roads
Definitions and Concepts Capacity (continue) • Prevailing traffic conditions: • They are not fixed but vary from hour to hour throughout the day. Hence the flows at any particular time are a function of: • The speed of vehicles • The composition of the traffic streams • The manner in which they interact with each other • The physical features of the roadway itself • Type of driver population • Directional distribution of traffic
Definitions and Concepts Capacity (continue) • Prevailing control conditions: • They refer to the types and specific design of control devices and traffic regulations present on a given facility. • the location, type, and timing of traffic signals; • stop and yield signs; • lane use restrictions; and • turn restrictions.
Basic Principles of traffic flow Traffic flow measures The operational state of any given traffic stream is defined by three primarily measures: -Speed. (Studied in chapter 2). -Volume and /or rate of flow. (Studied in chapter 2). -Density.
Basic Principles of traffic flow Traffic flow measures (continue) Density is defined as the number of vehicles occupying a unit length of a traffic lane at a given instant (veh/km) Density (used in USA)= Concentration (Used in England) It can be computed from the speed and the rate of flow, which is: q = V * K Where: q = Rate of flow, in vehicle/hr; V = Average travel speed in Km/hr; and K = Density in vehicle/km.
Diverge Merge Basic Freeway Segment Capacity Analysis and Design for a Freeway Segment Definition • A freeway is defined as a divided highway with full control of access and two or more lanes for the exclusive use of traffic in each direction. • Freeways provide uninterrupted flow. • There are no signalized or stop-controlled at-grade intersections, and direct access to and from adjacent property is not permitted. • Access to and from the freeway is limited to ramp locations. • Opposing directions of flow are continuously separated by a raised barrier, an at-grade median, or a continuous raised median.
Capacity Analysis and Design for a Freeway Segment Definition Basic freeway segments are outside of the influence area of ramps or weaving areas of the freeway. This Figure illustrates a basic freeway segment. The following Figures illustrate the ramp influence area and weaving segment: On- And Off-Ramp Influence Areas
Capacity Analysis and Design for a Freeway Segment Definition Type A Weaving Segments
Capacity Analysis and Design for a Freeway Segment Freeway Capacity Terms Freeway capacity: the maximum sustained 15-min flow rate, expressed in passenger cars per hour per lane, that can be accommodated by a uniform freeway segment under prevailing traffic and roadway conditions in one direction of flow. Traffic characteristics: any characteristic of the traffic stream that may affect capacity, free-flow speed, or operations, including the percentage composition of the traffic stream by vehicle type and the familiarity of drivers with the freeway. Roadwaycharacteristics: the geometric characteristics of the freeway segment under study, including the number and width of lanes, right-shoulder lateral clearance, interchange spacing, vertical alignment, and lane configurations.
Capacity Analysis and Design for a Freeway Segment Freeway Capacity Terms Free-flow speed (FFS): the mean speed of passenger cars that can be accommodated under low to moderate flow rates on a uniform freeway segment under prevailing roadway and traffic conditions. Base conditions: an assumed set of geometric and traffic conditions used as a starting point for computations of capacity and level of service (LOS). Capacity analysis is based on freeway segments with uniform traffic and roadway conditions. If any of the prevailing conditions change significantly, the capacity of the segment and its operating conditions change as well. Therefore, each uniform segment should be analyzed separately.
Capacity Analysis and Design for a Freeway Segment Base Conditions for Basic Freeway Segments The base conditions under which the full capacity of a basic freeway segment is achieved are good weather, good visibility, and no incidents or accidents. For the analysis procedures in this chapter, these base conditions are assumed to exist. If any of these conditions fails to exist, the speed, LOS, and capacity of the freeway segment all tend to be reduced. The specific speed-flow-density relationship of a basic freeway segment depends on prevailing traffic and roadway conditions. A set of base conditions for basic freeway segments has been established.
Capacity Analysis and Design for a Freeway Segment Base Conditions for Basic Freeway Segments • These conditions serve as a starting point for the methodology in this chapter. • Minimum lane widths of 3.6 m; • Minimum right-shoulder lateral clearance between the edge of the travel lane and the nearest obstacle or object that influences traffic behavior of 1.8 m; • Minimum median lateral clearance of 0.6 m; • Traffic stream composed entirely of passenger cars; • Five or more lanes for one direction (in urban areas only); • Interchange spacing at 3 km or greater; • Level terrain, with grades no greater than 2 percent; and • A driver population composed principally of regular users of the facility. • These base conditions represent a high operating level, with a free-flow speed (FFS) of 110 km/h or greater.
Capacity Analysis and Design for a Freeway Segment Base Conditions for Basic Freeway Segments Examples of interchanges
Capacity Analysis and Design for a Freeway Segment Base Conditions for Basic Freeway Segments Interchange Spacing
Capacity Analysis and Design for a Freeway Segment Methodology The methodology described in this section is for the analysis of basic freeway segments. The following Figure illustrates input to and the basic computation order of the method for basic freeway segments. The primary output of the method is LOS.
Continue: Basic Freeway Segment Methodology
Continue: Basic Freeway Segment Methodology
Capacity Analysis and Design for a Multilane Highway Definition • This section treats the capacity analysis of multilane highway that cannot be classified as a freeways because they are undivided, lack control of access, or both. • Between points of fixed interruption, multilane highways operate under uninterrupted conditions.
Capacity Analysis and Design for a Multilane Highway Definition • Such flow however is not as efficient as flow on freeways because of source of side- and medium-frictions which exist on multilane highways, such as: • Vehicles enter and leave the roadside to access parking lots, driveways, Unsignalized intersection, and other points. • The friction due to opposing vehicles on undivided multilane roadways also impacts negatively on flow. • The visual impact of development fronting directly on the highway influences the driver behaviour, and contributes to its being less efficient than on comparable freeways.
Capacity Analysis and Design for a Multilane Highway Definition Multilane highways may exhibit some of the following characteristics: • Posted speed limits are usually between 60 and 100 km/h • They may be undivided or include medians • They are located in suburban areas or in high-volume rural corridors • They may include a two-way, left-turn median lane (TWLTL) • Traffic volumes range from 15,000 to 40,000/day • Volumes are up to 100,000/day with grade separations and no cross-median access • Traffic signals at major crossing points are possible • There is partial control of access
Capacity Analysis and Design for a Multilane Highway BASE CONDITIONS FOR MULTILANE HIGHWAYS The procedures in this chapter determine the reduction in travel speed that occurs for less-than-base conditions. Under base conditions, the full speed and capacity of a multilane highway are achieved. These conditions include good weather, good visibility, and no incidents or accidents. Studies of the flow characteristics of multilane highways have defined base conditions for developing flow relationships and adjustments to speed.
Capacity Analysis and Design for a Multilane Highway BASE CONDITIONS FOR MULTILANE HIGHWAYS • The base conditions for multilane highways are as follows: • 3.6-m minimum lane widths; • 3.6-m minimum total lateral clearance in the direction of travel—this represents the total lateral clearances from the edge of the travelled lanes to obstructions along the edge of the road and in the median (in computations, lateral clearances greater than 1.8 m are considered in computations to be equal to 1.8 m); • Only passenger cars in the traffic stream; • No direct access points along the roadway; • A divided highway; and • Free-flow speed (FFS) higher than 100 km/h.
Capacity Analysis and Design for a Multilane Highway 5.4.3 Methodology The same methodology used in the freeway section is applied to the multilane highway.
Capacity Analysis and Design for a Multilane Highway LOS Criteria Although speed is a major concern of drivers, freedom to maneuver within the traffic stream and the proximity to other vehicles are also important. LOS criteria are listed in LOS criteria are listed in Exhibit 21-2. The criteria are based on the typical speed-flow and density-flow relationships shown in Exhibit and 12-2. Exhibit 21-3 shows LOS boundaries as sloped lines, each corresponding to a constant value of density
Exhibit 21-3. Speed-Flow Curves and LOS for Multilane Highway
Capacity Analysis and Design for a Multilane Highway Determining FFS The FFS can be estimated indirectly when field data are not available.
Adjustment for Lane Width Exhibit 21-4. Adjustments for Lane Width
Adjustment for Lateral Clearance Exhibit 21-5 lists the speed reductions caused by the lateral clearance for fixed obstructions on the roadside or in the median. Fixed obstructions with lateral clearance effects include light standards, signs, trees, abutments, bridge rails, traffic barriers, and retaining walls. Standard raised curbs are not considered obstructions.
Adjustment for Lateral Clearance Exhibit 21-5 shows the appropriate reduction in FFS based on the total lateral clearance, which is defined as:
Exhibit 21-5. Adjustments Lateral Clearance Thus, a total lateral clearance of 3.6 m is used for a completely unobstructed roadside and median; however, the actual value is used when obstructions are located closer to the roadway. The adjustment for lateral clearance on six-lane highways is slightly less than for four-lane highways because lateral obstructions have a minimal effect on traffic operations in the center lane of a three-lane roadway.
Adjustment for Median Type The values in Exhibit 21-6 indicate that the average FFS should be decreased by 2.6 km/h for undivided highways to account for the friction caused by opposing traffic in an adjacent lane. Exhibit 21-6. Adjustments for Median Type
Adjustment for Access-Point Density Exhibit 21-7 presents the adjustment to FFS for various levels of access-point density. The data indicate that for each access point per kilometer the estimated FFS decreases by approximately 0.4 km/h, regardless of the type of median. The access-point density on a divided roadway is determined by dividing the total number of access points ( i.e., intersections and driveways) on the right side of the roadway in the direction of travel by the segment’s total length in kilometers.
Adjustment for Access-Point Density An intersection or driveway should only be included if it influences traffic flow. Access points unnoticed by the driver or with little activity should not be included in determining access-point density. Exhibit 21-7. ACCESS-POINT DENSITY ADJUSTMENT
Adjustment for Access-Point Density An intersection or driveway should only be included if it influences traffic flow. Access points unnoticed by the driver or with little activity should not be included in determining access-point density. Exhibit 21-7. ACCESS-POINT DENSITY ADJUSTMENT
Determining Flow Rate • The hourly flow rate must reflect: • The influence of heavy vehicles; • The temporal variation of traffic flow over an hour; and • The characteristics of the driver population. • These effects are reflected by adjusting hourly volumes or estimates, typically reported in vehicles per hour (veh/h), to arrive at an equivalent passenger-car flow rate in passenger cars per hour (pc/h). The equivalent passenger-car flow rate is calculated using the heavy-vehicle and peak-hour adjustment factors and is reported on a per lane basis (pc/h/ln).
Determining Flow Rate The following equation is used to calculate the equivalent passenger-car flow Where
Peak-Hour Factor PHF represents the variation in traffic flow within an hour. Observations of traffic flow consistently indicate that the flow rates found in the peak 15-min period within an hour are not sustained throughout the entire hour.
Heavy-Vehicle Adjustments The presence of heavy vehicles in the traffic stream decreases the FFS because base conditions allow a traffic stream of passenger cars only. Therefore, traffic volumes must be adjusted to reflect an equivalent flow rate expressed in passenger cars per hour per lane (pc/h/ln). This is accomplished by applying the heavy-vehicle factor (fHV). Once values for ET and ER have been determined, the adjustment factor for heavy vehicles may be computed as shown in Equation. Where