Download
1 / 4
50 likes | 228 Views
Pyramid Building. Interpret the chart: Which age group has the greatest proportion of people? Which bar includes the students in this classroom? Are there more people in your age group or in the age group below yours?. Population pyramids show the age and sex structure of a population.

E N D
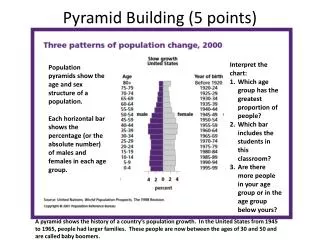
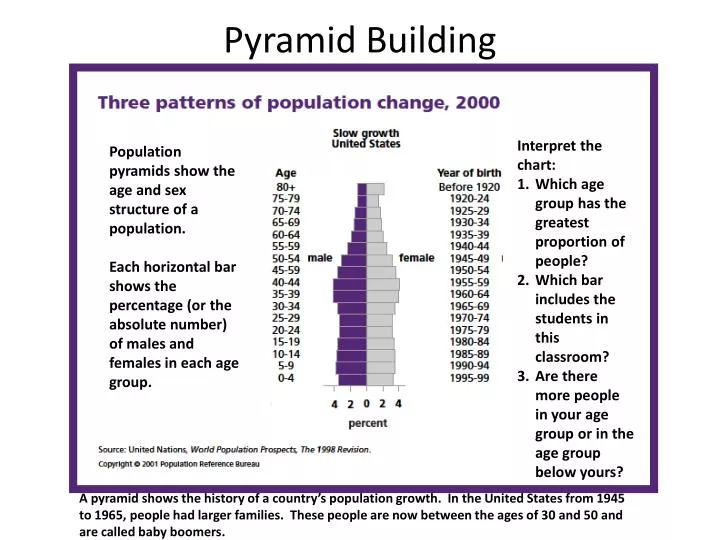
Pyramid Building Interpret the chart: Which age group has the greatest proportion of people? Which bar includes the students in this classroom? Are there more people in your age group or in the age group below yours? Population pyramids show the age and sex structure of a population. Each horizontal bar shows the percentage (or the absolute number) of males and females in each age group. A pyramid shows the history of a country’s population growth. In the United States from 1945 to 1965, people had larger families. These people are now between the ages of 30 and 50 and are called baby boomers.
Describe Congo’s population structure. How is Congo’s pyramid different from that of the U.S.? Which age group in the Congo is the largest? What proportion of the population is in this age group? Now look at Germany. How is it different form the U.S. and Congo? 6. Why would a country’s leaders want to know the proportion of the population in different age groups? 7. What difference does the age of the people in a country make? 8. What kind of products to young people use? What kind of services do they need? 9. What about older people? 10. Is it important for a government leader or planner to know the age of the population they are serving?
Assignment: Each student is going to draw a population pyramid for a specific country. However, we will practice first with the U.S. These pyramids will only have 4 age categories instead of 16 like the ones we looked at. In your notebook draw the modified population pyramid below: Males Females 60+ 40-59 20-39 0-19 30 25 20 15 10 5 0 5 10 15 20 25 30 Percent of population
U. S. Population by age 2000 (percent) Source: U.S. Census 2000 You will be assigned a random country 1-37 to make a modified population pyramid. When finished discuss and answer the following question. What are the similarities and differences in the shapes of their pyramids? What might be some of the reasons for different shapes? What country do you think you have?