Download
1 / 28
280 likes | 505 Views
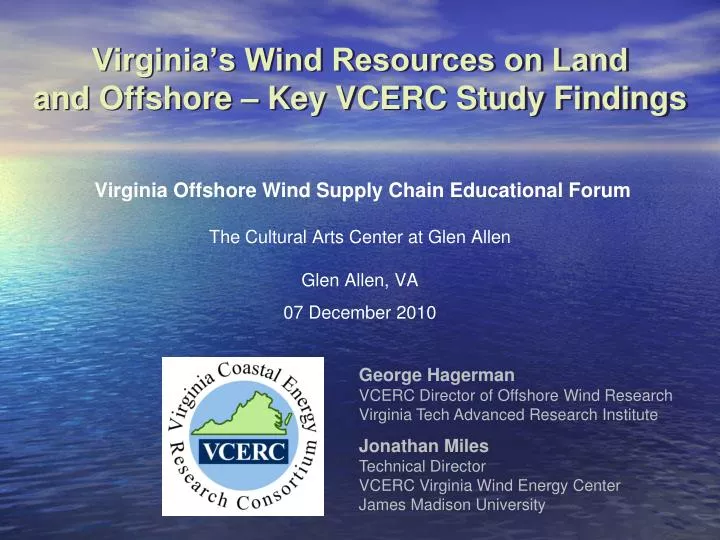
Virginia Offshore Wind Supply Chain Educational Forum The Cultural Arts Center at Glen Allen Glen Allen, VA 07 December 2010. Virginia’s Wind Resources on Land and Offshore – Key VCERC Study Findings. George Hagerman VCERC Director of Offshore Wind Research

E N D
Virginia Offshore Wind Supply Chain Educational Forum The Cultural Arts Center at Glen Allen Glen Allen, VA 07 December 2010 Virginia’s Wind Resources on Landand Offshore – Key VCERC Study Findings George Hagerman VCERC Director of Offshore Wind Research Virginia Tech Advanced Research Institute Jonathan Miles Technical Director VCERC Virginia Wind Energy Center James Madison University
Comparing Key Aspects of Land-Basedand Offshore Wind Energy Resources in Virginia Class 5+ areas needed for economical offshore projects are in federal waters beyond 3-n.mile limit of state jurisdiction Class 3+ areas needed for economical onshore projects are largely on ridges in national forests and parks, but even projects on private land seem difficult to permit National Forests, Blue Ridge Parkway, Appalachian Trail, state parklands, and county-by-county zoning variability Federal regulatory authority is the Bureau of Ocean Energy Management, Regulation, and Enforcement Source: http://gcep.stanford.edu/pdfs/energy_workshops_04_04/wind_bailey.pdf
Ownership of Virginia’s Wind Energy Areas • Two-thirds of Virginia’s Class 3+ wind energy resources are located in the state waters of the Chesapeake Bay and Atlantic Ocean. Of the remaining third on shore, more than half are located on publicly used Federal lands.
Wind Resources in Harrisonburg Vicinity George Washington National Forest LEE Ranger District George Washington National Forest DRY RIVER Ranger District Shenandoah National Park Private ownership
Wind Resources in Lexington Vicinity George Washington National Forest DEERFIELD, WARM SPRINGS, and JAMES RIVER Ranger Districts George Washington National Forest PEDLAR Ranger District Thomas Jefferson National Forest Thomas Jefferson National Forest
Wind Resources in Roanoke Vicinity Thomas Jefferson National Forest Thomas Jefferson National Forest Mount Rogers National Recreation Area
Virginia’s Offshore Wind Potential is Large;Is it Cost-Competitive with Fossil Fuel Generation? Fentress VCERC identified 25 MMS lease blocks that appeared to have minimal conflict with existing uses by the Navy, NASA-Wallops, commercial shipping, or commercial fishing. These are all beyond 12 nautical miles offshore and in water depths less than 100 ft, and could support 3,200 MW of wind capacity generating 11 TWh/yr, or 10% of VA’s annual energy demand.
Hypothetical Offshore Wind ProjectLocation for Cost & Performance Evaluation
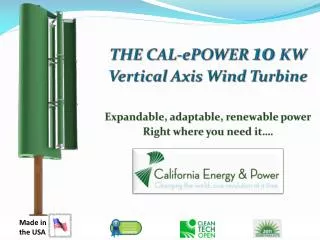
Offshore Wind Project Cost Estimated by VCERC Cost Model • Capital cost estimated in March 2008 dollars using NREL parametric model for wind turbine & tower, Virginia maritime supplier bids for foundations & installation, and published data for balance of plant • Plant cost at offshore busbar: $ 1,763 million • Transmission cost to Fentress: $ 153 million • Total project investment: $ 1,916 million (~ $3,260 / kW) • 588 MW installedrated capacity(7 x 7 turbinesper lease block) • 38% annualcapacity factor • 20% PJM summercapacity factor(JJA 3pm – 6pm) Vestas V90-3MW
VCERC Modeled Capital Costs Comparedwith European Project Data for Major Cost Centers London Array I630 MW Siemens SWT-3.6-120 Global Tech I400 MW Multibrid M5000 Thanet300 MW if fabricated in Hampton Roads Lincs270 MW Based on MTH announced contract value in March 2010 Lincs270 MW Based on MTH max steel weights if fabricated in Hampton Roads
VCERC Modeled Capital Costs Comparedwith European Project Data for Major Cost Centers London Array I630 MW Nexans 150 kV50 km offshore VCERC Model588 MW 138 kV28 km offshore Sheringham Shoal317 MW Nexans 145 kV20 km offshore VCERC Model588 MW 168 km, 33 kV Sheringham Shoal317 MW 81 km, 36 kV Nordsee Ost288 MW 63 km, 33 kV
Cost of Energy Comparison BetweenOffshore Wind and New Coal-Fired Generation Updated fuel market scenario2012 price: $60-80 per short ton4% to 6% real annual escalation(see back-up slides)
Cost of Energy Comparison BetweenOffshore Wind and New Coal-Fired Generation European turbine supply Domestic turbine supply
Cost of Energy Comparison BetweenOffshore Wind and New Gas-Fired Generation Updated fuel market scenario2012 price: $5.50-6.00 per MMBTU2% to 4% real annual escalation(see back-up slides)
Cost of Energy Comparison BetweenOffshore Wind and New Gas-Fired Generation European turbine supply Domestic turbine supply
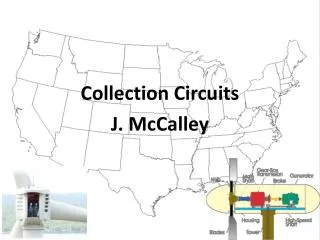
Offshore Wind Economic Development:Breakdown of Capital Investment by Percentage Turbine & Tower Package66% Power Collection: 6% Power Transmission: 5% Project Management2% Local Balance of Plant21%
Offshore Wind Economic Development:Dollars and Jobs Breakdown for One Project Turbine & Tower Package$1,268 million Submarine Power Cables$213 million 588 MW reference baseline Project Management$40 million Local Balance of Plant$395 million
Offshore Wind Economic Development:Dollars and Jobs Breakdown for One Project Turbine & Tower Package$1,268 million Submarine Power Cables$213 million Turbine Assembly and Component Manufacture (based on 2007 EU data)7,350 jobs for two years (direct + indirect) 588 MW reference baseline Local Balance of Plant1,440 jobs for two years (direct + indirect + induced) Project Management$40 million Local Balance of Plant$395 million
Offshore Wind Economic Development:Dollars and Jobs Breakdown for One Project Turbine & Tower Package$1,268 million Submarine Power Cables$213 million Turbine Assembly and Component Manufacture (based on 2007 EU data)7,350 jobs for two years (direct + indirect) 588 MW reference baseline Local Balance of Plant1,440 jobs for two years (direct + indirect + induced) Project Management$40 million Local Balance of Plant$395 million
Early, Meaningful Engagement ofLocal Stakeholders Essential to Success
Virginia Offshore Wind Development Authority Established to Provide Enabling Infrastructure Before making a ~$2 billion investment(as would be needed for a 600 MW project in federal waters) or a $500 million investment in a Hampton Roads turbine manufacturing complex, full-scale offshore testing must be done(costing$60-75 millionover 5 yrs)
Virginia’s Concept for a NationalOffshore Wind Test Center in Hampton Roads In response to a recent Department of Energy Request for Information (RFI), Virginia has suggested the concept of a National Offshore Wind Test Center, developed in three stages that would offer progressively more energetic wind climates and more challenging conditions for turbine access. The Stage II test pads would be cited at least 1 km south of the CBBT.
Thank You! PDF of Virginia response to DOE RFI is posted at:http://media2.wavy.com/html/PDFs/71410%20Virginia%20DOE%20Offshore%20Wind%20RFI%20Response%20Final.pdf VCERC Offshore Wind Studies Final Report:www.vcerc.org/report.htm Any questions? Email: hagerman@vt.edu or milesjj@jmu.edu
Historical Volatility in Coal Prices Coal prices are rebounding more quickly than assumed in original VCERC report Source: Edison Electric Institute: Q2 2010 Financial Update: Fuel(www.eei.org/whatwedo/DataAnalysis/IndusFinanAnalysis/Documents/2010_Q2_Fuel_Final.pdf)
Recent Delivered Coal Prices Assumed price range in first year (2012) Source: Edison Electric Institute: Q2 2010 Financial Update: Fuel(www.eei.org/whatwedo/DataAnalysis/IndusFinanAnalysis/Documents/2010_Q2_Fuel_Final.pdf)
Near-Term Forecast ofCentral Appalachian Coal Spot Market Prices 6% nominal annual escalation rate Source: Edison Electric Institute: Q2 2010 Financial Update: Fuel(www.eei.org/whatwedo/DataAnalysis/IndusFinanAnalysis/Documents/2010_Q2_Fuel_Final.pdf)
Historical Volatility in Natural Gas Prices Natural gas prices have declined and are likely to have a lower 2012 price than assumed in original VCERC report Source: Edison Electric Institute: Q2 2010 Financial Update: Fuel(www.eei.org/whatwedo/DataAnalysis/IndusFinanAnalysis/Documents/2010_Q2_Fuel_Final.pdf)
Near-Term Forecast ofHenry Hub Natural Gas Spot Market Prices 4% nominal annual escalation rate Source: Edison Electric Institute: “Q2 2010 Financial Update: Fuel”(www.eei.org/whatwedo/DataAnalysis/IndusFinanAnalysis/Documents/2010_Q2_Fuel_Final.pdf)