Download
1 / 30
300 likes | 507 Views
Grid models of population: temporal comparison by fixing the geography . David Martin, School of Geography University of Southampton. Overview. Problems of comparison over time Merits of using gridded data Data sources Grid modelling principles Grid modelling resources

E N D
Grid models of population: temporal comparison by fixing the geography David Martin, School of Geography University of Southampton
Overview • Problems of comparison over time • Merits of using gridded data • Data sources • Grid modelling principles • Grid modelling resources • Example: Southampton 1981-2003 • Conclusions
Problems of comparison over time • Population changes location and composition • Boundaries and definitions are recast between data collection events; measurement success varies • Cannot disentangle true change from representation and measurement • If geographical units remained the same, one part of the problem would be addressed
Southampton 1991 EDs • N = 417 • mean address count = 228 • Population 197,000
Southampton 2001 OAs (test data) • N = 762 • mean address count = 125 • 6.2% overall population increase
Intersection of EDs and OAs • N = 1771 • mean address count = 54 • Where was the increase? • (and ED to ED was no better)
Merits of using gridded data • Grid cell data comparable through time • Settlement geography is retained • No boundary data required for geographical comparison • Readily combined with gridded environmental models
Data sources • Great Britain: 1971 census gridded data published but not available • Northern Ireland: 1971-2001 grid square data published • No general GB grid counts 1981- • Spatial modelling required • 1971-2001 population-weighted centroid locations published • Postcode locations can be treated as centroids
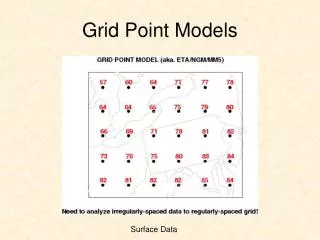
Grid modelling principles (1) • Population-weighted centroid(s) as summary points of local distribution • Locally adaptive kernel estimation based on inter-centroid distances • Redistribution of centroid counts into grid • Could use dasymetric and other methods • This is NOT interpolation
Grid modelling principles (2) Weighting wij a Distance dij k Centroid
Grid modelling principles (3) Centroids and boundaries Gridded population model
NI surfaces 1991 • Construct surfaces from NI 1991 ED centroids • Experiment with dispersion, postcode centroids, directional interpolators • Selective comparison with grid square data • Martin, Tate and Langford (2000)
Standard model Postcode centroids Empirical kernel width Directional kernels
Grid modelling resources • NI grid square dataare true count data for download • SURPOP provides 1981 and 1991 ready-made surfaces • SurfaceBuilder allows construction of own surfaces from centroid data • (URLs on final slide…)
Surpop • Requires census data registration • 200m cells • 1981 or 1991 • Select variable • Extract window • Export to GIS
SurfaceBuilder • Download and install VB program • Download X,Y,Z centroid data file • Specify surface parameters • Run and preview model • Export to GIS
Example: Southampton 1981-2001 • 25 x 25km region centred on City of Southampton • Population change 1981-2003 from census and postcode data • 1980s: large-scale greenfield development at urban fringe • 1990s: combined with brownfield redevelopment within urban area
1981-91-01 change, 0.2km 1981 1991-81 1991 2001-91 2001
1981-91-01 change, 1km t2-t1 (t2-t1)/(t2+t1) 1981 1991 2001
Contemporary change: postcodes • All Fields Postcode Directory providing quarterly postcode record • Downloadable from UKBORDERS • Very big files! • Postcodes as centroids with household counts can be modelled onto grid • Census counts could be reallocated
2001-02-03 change, 0.2km (AFPD households) 2001 2002-01 2002 2003-02 2003
Conclusions • Grid-based modelling offers specific advantages over small areas • Longer-scale neighbourhood change • Monitoring contemporary change • Practical modelling advantages • Problem of noise due to centroid relocation (requires smoothing) • Challenge of definitional drift and measurement error remains
Key URLs • Northern Ireland grid square data http://census2.mc.man.ac.uk/cdu/2001/ni/GRID/index.htm • Surpop http://census.ac.uk/cdu/software/surpop/ • SurfaceBuilder http://www.geog.soton.ac.uk/users/martindj/davehome/software.htm