Download
1 / 5
50 likes | 57 Views
Earthquakes are known to produce one of the most destructive forces on earth. It has been seen that during past earthquakes many of the buildings were collapsed. Therefore, realistic method for analysis and design are required. Performance Based Design is the modern approach for earthquake resistant design. It is an attempt to predict the performance of buildings under expected seismic event. A structure designed with Performance Based Design PBD concept does not developed undesirable failure mechanism during earthquake. The analysis can be performed on new as well as existing buildings and the performance of buildings in future earthquake can be evaluated. In this research we apply different type type of analysis method on the 30 storey building plan and compare the result. Priyank H. Patel | Jenish M. Mistry | Vishal N. Patel "Analysis of Multi- Storey Building using Structural Software MIDAS General" Published in International Journal of Trend in Scientific Research and Development (ijtsrd), ISSN: 2456-6470, Volume-4 | Issue-4 , June 2020, URL: https://www.ijtsrd.com/papers/ijtsrd30961.pdf Paper Url :https://www.ijtsrd.com/engineering/civil-engineering/30961/analysis-of-multi-storey-building-using-structural-software-midas-general/priyank-h-patel<br>

E N D
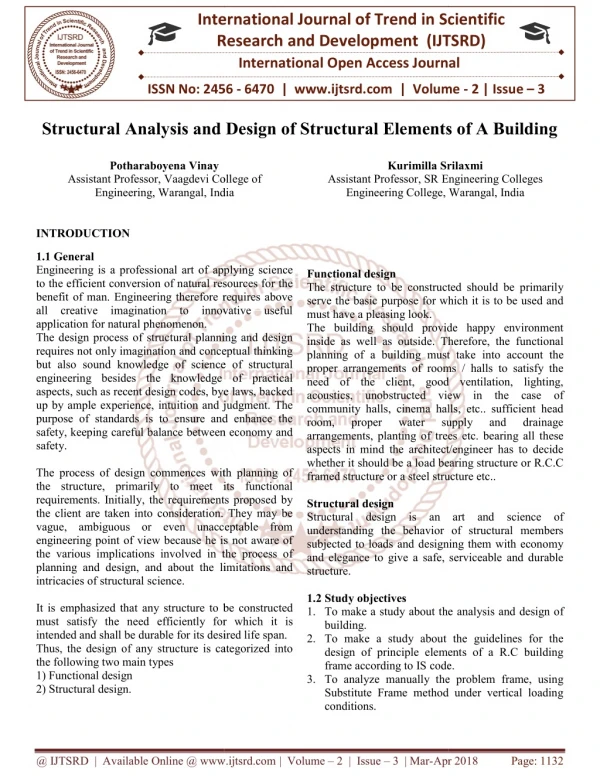
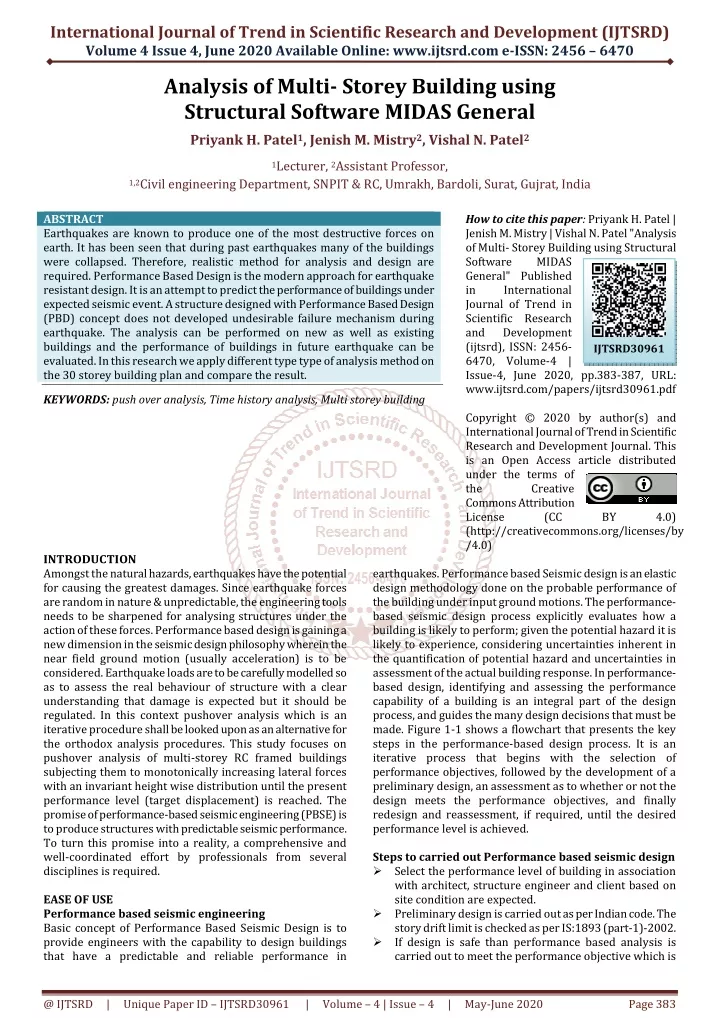
International Journal of Trend in Scientific Research and Development (IJTSRD) Volume 4 Issue 4, June 2020 Available Online: www.ijtsrd.com e-ISSN: 2456 – 6470 Analysis of Multi- Storey Building using Structural Software MIDAS General Priyank H. Patel1, Jenish M. Mistry2, Vishal N. Patel2 1Lecturer, 2Assistant Professor, 1,2Civil engineering Department, SNPIT & RC, Umrakh, Bardoli, Surat, Gujrat, India ABSTRACT Earthquakes are known to produce one of the most destructive forces on earth. It has been seen that during past earthquakes many of the buildings were collapsed. Therefore, realistic method for analysis and design are required. Performance Based Design is the modern approach for earthquake resistant design. It is an attempt to predict the performance of buildings under expected seismic event. A structure designed with Performance Based Design (PBD) concept does not developed undesirable failure mechanism during earthquake. The analysis can be performed on new as well as existing buildings and the performance of buildings in future earthquake can be evaluated. In this research we apply different type type of analysis method on the 30 storey building plan and compare the result. KEYWORDS: push over analysis, Time history analysis, Multi storey building How to cite this paper: Priyank H. Patel | Jenish M. Mistry | Vishal N. Patel "Analysis of Multi- Storey Building using Structural Software MIDAS General" Published in International Journal of Trend in Scientific Research and Development (ijtsrd), ISSN: 2456- 6470, Volume-4 | Issue-4, June 2020, pp.383-387, URL: www.ijtsrd.com/papers/ijtsrd30961.pdf Copyright © 2020 by author(s) and International Journal of Trend in Scientific Research and Development Journal. This is an Open Access article distributed under the terms of the Creative Commons Attribution License (CC (http://creativecommons.org/licenses/by /4.0) IJTSRD30961 BY 4.0) INTRODUCTION Amongst the natural hazards, earthquakes have the potential for causing the greatest damages. Since earthquake forces are random in nature & unpredictable, the engineering tools needs to be sharpened for analysing structures under the action of these forces. Performance based design is gaining a new dimension in the seismic design philosophy wherein the near field ground motion (usually acceleration) is to be considered. Earthquake loads are to be carefully modelled so as to assess the real behaviour of structure with a clear understanding that damage is expected but it should be regulated. In this context pushover analysis which is an iterative procedure shall be looked upon as an alternative for the orthodox analysis procedures. This study focuses on pushover analysis of multi-storey RC framed buildings subjecting them to monotonically increasing lateral forces with an invariant height wise distribution until the present performance level (target displacement) is reached. The promise of performance-based seismic engineering (PBSE) is to produce structures with predictable seismic performance. To turn this promise into a reality, a comprehensive and well-coordinated effort by professionals from several disciplines is required. EASE OF USE Performance based seismic engineering Basic concept of Performance Based Seismic Design is to provide engineers with the capability to design buildings that have a predictable and reliable performance in earthquakes. Performance based Seismic design is an elastic design methodology done on the probable performance of the building under input ground motions. The performance- based seismic design process explicitly evaluates how a building is likely to perform; given the potential hazard it is likely to experience, considering uncertainties inherent in the quantification of potential hazard and uncertainties in assessment of the actual building response. In performance- based design, identifying and assessing the performance capability of a building is an integral part of the design process, and guides the many design decisions that must be made. Figure 1-1 shows a flowchart that presents the key steps in the performance-based design process. It is an iterative process that begins with the selection of performance objectives, followed by the development of a preliminary design, an assessment as to whether or not the design meets the performance objectives, and finally redesign and reassessment, if required, until the desired performance level is achieved. Steps to carried out Performance based seismic design ?Select the performance level of building in association with architect, structure engineer and client based on site condition are expected. ?Preliminary design is carried out as per Indian code. The story drift limit is checked as per IS:1893 (part-1)-2002. ?If design is safe than performance based analysis is carried out to meet the performance objective which is @ IJTSRD | Unique Paper ID – IJTSRD30961 | Volume – 4 | Issue – 4 | May-June 2020 Page 383
International Journal of Trend in Scientific Research and Development (IJTSRD) @ www.ijtsrd.com eISSN: 2456-6470 interpreted by both quantified hazard level and quantified performance level. ?If performance point is not meet to objective revise the design by increasing or decreasing percentage of steel or size of member. The process of analysis and design is repeated till expected performance objectives are met. Capacity and demand both change with structural design. Performance based design is iterative in nature compared to one step analysis and design as per IS: 1893(Part1)-2002. Push-Over Analysis Pushover analysis is a static, nonlinear procedure using simplified nonlinear technique to estimate seismic structural deformations. It is an incremental static analysis used to determine the force-displacement relationship, or the capacity curve, for a structure or structural element. The analysis involves applying horizontal loads, in a prescribed pattern, to the structure incrementally, i.e. pushing the structure and plotting the total applied shear force and associated lateral displacement at each increment, until the structure or collapse condition. In technique a computer model of the building is subjected to a lateral load of a certain shape (i.e., inverted triangular or uniform). The intensity of the lateral load is slowly increased and the sequence of cracks, yielding, plastic hinge formation, and failure of various structural components is recorded. Pushover analysis can provide a significant insight into the weak links in seismic performance of a structure. The performance criteria for pushover analysis are generally established as the desired state of the building given roof-top or spectral displacement amplitude. Types of Push-Over Analysis Forced Controlled Used when load is known and structure is desired to support this load. For gravity load on structure force controlled, push over analysis is used. Displacement Controlled Used when load is unknown but displacement is known and structure is desired to lose their strength and become unstable. For lateral load on structure displacement controlled, pushover analysis is used. Capacity-Curve It is represents the increasing lateral displacement as a function of the force applied monotonically from zero to the ultimate level corresponding to the incipient collapse of the structure and response behaviour is gauged by measurement of strength of structure. The simplified nonlinear procedure is followed for the generation of the capacity curve. This capacity curve is in form of Base Shear versus Displacement curve which is converted in to Spectral Acceleration (Sa) versus Spectral Displacement (Sd) curve. An approximate effective damping is also calculated based on the shape of the capacity curve. Spectral Acceleration (Sa) versus Time Period (T) curve is given in IS: 1893(Part1)-2002 which is converted in to Spectral Acceleration (Sa) versus Spectral. Displacement (Sd) curve, Capacity curve and Demand curve are generated in spectral coordinates to find- out performance point ap and dp. The equal displacement a’ and d’ is good starting point for the iterative process as shown in Fig.1.2. The location of performance point must satisfy two relationships: 1) the point must lie on the capacity spectrum curve in order to represent the structure at a given displacement, and (2) the point must lie on a demand spectrum curve or 5% damped design spectrum, that represent the nonlinear demand at the same structural displacement. For this methodology, spectral reduction factors are given in term of effective damping. An approximate effective damping is calculated based on the shape of capacity curve, different soil profile, and resulting hysteresis loop. Fig.1.2 Demand spectra curve Performance Point Curve Performance Point Curve The intersection of the pushover capacity and demand spectrum curves defines as the “performance point” as shown in Fig. 1.3. Allowable tolerance is considered within 5% of the displacement of the trial performance point. Using the Performance Point or Target Displacement, the global response of the structure and individual component deformations are compared with specific performance goals for building as per ATC 40 criteria. Fig.1.3 Performance Point curve Advantages of Push-Over Analysis 1. It allows us to evaluate overall structural behaviours and performance characteristics. 2. It enables us to investigate the sequential formation of plastic hinges in the individual structural elements constituting the entire structure. 3. When a structure is to be strengthened through a rehabilitation process, it allows us to selectively reinforce only the required members maximizing the cost efficiency. 4. 4) The pushover analysis provides good estimate of global and local inelastic deformation demands for structures that vibrate primarily in the fundamental mode. Fig. 1.1 Capacity curve Demand Spectra Curve @ IJTSRD | Unique Paper ID – IJTSRD30961 | Volume – 4 | Issue – 4 | May-June 2020 Page 384
International Journal of Trend in Scientific Research and Development (IJTSRD) @ www.ijtsrd.com eISSN: 2456-6470 Disadvantages of Push-Over Analysis 1.Deformation estimates obtained from a pushover analysis may be grossly inaccurate for structures where higher mode effects are significant. 2.In most cases it will be necessary to perform the analysis with displacement rather than force control, since the target displacement may be associated with very small positive or even a negative lateral stiffness because of the development of mechanisms and P-delta effects. 3.Pushover analysis implicitly assurances that damage is a function only of the lateral deformation of the structure, neglecting duration effects, number of stress reversals and cumulative energy dissipation demand 4.The procedure does not take into account for the progressive changes in modal properties that take place in a structure as it experiences cyclic non-linear yielding during earthquake. 5.Most critical is the concern that the pushover analysis may detect only the first local mechanism that will form in an earthquake mechanism that will form in an earthquake and may not expose other weakness that will be generated when the structures dynamic characteristics change after formation of first local mechanism. Modelling in software General Information Table.1.2 Value of base shear Fig. 1.4 Value of Base shear Comparison of Displacement: Method Of Analysis Response Spectrum Method Time History Method Pushover Analysis Table.1.3 Comparison of displacement Value(m) 0.0896 0.0349 0.1341 Fig.1.5 Comparison of displacement Comparison of Storey Drift (X): Method Of Analysis Response Spectrum Method Time History Method Pushover Analysis Table.1.4 Comparison of Storey drift (X) Value(m) 0.0036 0.0149 0.0078 Fig. 1.4 Modelling in software Sr. no 1 2 3 4 5 6 Name Detail of Model G + 30 5 m 5 m 500 x 500 mm 300 x 300 mm 150 mm 4 KN/m2typical 1.5 KN/m2terrace Storey height Spacing along X direction Spacing along Y direction Size of column Size of beam Slab thickness Fig. 1.6 Comparison of Storey drift (X) Comparison of Storey Drift (Y): Method Of Analysis Response Spectrum Method Time History Method Pushover Analysis Table.1.5 Comparison of Storey drift (Y) 7 live load Value(m) 0.0036 0.0136 0.0145 8 9 10 Floor finish water proofing Earthquake 1 KN/m2 2 KN/m2 As per IS:1893 2002 Type II medium as per IS 1893 Zone III 11 Type of soil 12 Seismic zone Table.1.1 General details of the building Result Value of Base Shear: Method Of Analysis Response Spectrum Method Time History Method Pushover Analysis Value(KN) 995.21 6117.6 2772.83 @ IJTSRD | Unique Paper ID – IJTSRD30961 | Volume – 4 | Issue – 4 | May-June 2020 Page 385
International Journal of Trend in Scientific Research and Development (IJTSRD) @ www.ijtsrd.com eISSN: 2456-6470 7.rom the results of analysis of model we can conclude that it gives good results for Story Displacement (Y) for Response spectrum method i.e.0.0895 m. Fig. 1.7 Comparison of Storey Drift (Y) Comparison of Storey Displacement (X): Method of Analysis Response Spectrum Method Time History Method Pushover Analysis Table.1.6 Comparison of Storey displacement (X) Value(m) 0.0895 0.3425 0.1342 8.From the results of analysis Response Spectrum Method gives best result for analysis of tall structure. REFERENCES [1]Andreas J. Kappos, “Performance- Based Seismic Design of 3D R/C Buildings Using inelastic Static And Dynamic Analysis Procedures” ISTE Journal of Earthquake Technology, volume. 41, Paper No. 444, No.1, pp.141-158, March- 2004. Georgios Panagopoulos, [2]Applied Technology Council - 40 [3]D. N. Shinde, Nair Veena V, Pudale Yojana M, “ Pushover Analysis of Multi Story Building”, International Journal of Innovative Research in science, Engineering and Technology eISSN: 2319-1163, pISSN: 2321-7308. Fig. 1.8 Comparison of Storey displacement (X) Comparison of Storey Displacement (Y): Method Of Analysis Response Spectrum Method Time History Method Pushover Analysis Table.1.6 Comparison of Storey displacement (Y) [4]Dimpleben P. Sonwane, Dr. Kiran B. Ladhane, “Seismic Performance based Design of Reinforced Concrete Building using Nonlinear International Journal of Innovative Research in science, Engineering and Technology, volume.4 Issue 06, June- 2015, ISSN: 2278-0181. Value(m) 0.0895 0.3271 0.1342 Pushover analysis”, [5]Dr. Rehan A. Khan (2014), “Performance Based seismic Design of Reinforced Concrete Building “, International Journal of Innovative Research in science, Engineering and Technology volume. 3, ISSN: 2319-8753. [6]Federal Emergency Management Agency - 40 [7]Mohommed Anwaruddin Md. Akberuddin, Mohd. Zameeruddin Mohd. Saleemuddin, “Pushover Analysis of Medium Rice Multi-Story RCC Frame With and Without Vertical irregularity”, International journal of Engineering Research and Applications, volume. 3, Issue 5, Sep-Oct 2013, pp.540-546. Fig. 1.9 Comparison of Storey Displacement (Y) CONCLUSION In this work Performance Based Seismic Analysis of model with different methods of G+30 storey building has been carried out by MIDAS GEN and evaluating their performance parameters. [8]Prakash K. Siyani and Paresh V. Patel, “Comparison of Pushover Analysis Considering Site Response Spectra and Time History”, ACSGE-2009, OCT 25-27, BITS Pilani, India. [9]Prakash K. Siyani and Paresh V. Patel, “Effects of plastic hinge properties in Performance based design”, National Conference on Advances and Innovations in Civil Engineering (AICE’09), Tamilnadu, 25th March, 2009. 1.Pushover analysis is an elegant tool to visualize the performance level of a building under given earthquake. It gives valuable information for the Performance Based Analysis of building model. 2.From the results of analysis of model we can conclude that it gives good results for base shear for response spectrum method i.e. 995.2 KN. [10]Rahiman G. Khan, M. R. Vyawahare, “Pushover Analysis of Tall Building with Soft Stories at Different levels”, International Journal of Engineering Research and Applications, volume.3 Issue 4, Jul-Aug 2013, pp.176- 185, ISSN: 2248-9622. 3.From the results of analysis of model we can conclude that it gives good results for displacement for Time history method i.e.0.0349 m. [11]Rahul Rana, Limin Jin, Atila Zekloglu (2004), “Pushover Analysis of A 19 Story Concrete shear Wall Building”, 13th World Conference on Earthquake Engineering Vancouver, B.C., Canada August 1-6, Paper No.133. 4.From the results of analysis of model we can conclude that it gives good results for Story Drift (X) for response spectrum method i.e.0.0036 m. 5.From the results of analysis of model we can conclude that it gives good results for Story Drift (Y) for response spectrum method i.e.0.0036 m. [12]Rajesh M N, S K Prasad, “Seismic Performance Study on RC Wall Buildings form Pushover Analysis”, International Journal of Innovative Research in science, Engineering and Technology, eISSN: 2319-1163, pISSN: 2321-7308. 6.From the results of analysis of model we can conclude that it gives good results for Story Displacement (X) for Response spectrum method i.e.0.0895 m. @ IJTSRD | Unique Paper ID – IJTSRD30961 | Volume – 4 | Issue – 4 | May-June 2020 Page 386
International Journal of Trend in Scientific Research and Development (IJTSRD) @ www.ijtsrd.com eISSN: 2456-6470 [13]Riza Ainul Hakim, Mohammed Sohaib Alama, Samir A. Ashour, “Application of Pushover analysis for Evaluating Seismic Performance of RC Building”, International Journal of Innovative Research in science, Engineering and Technology volume.3 Issue 1, January- 2014 ISSN: 2278-0181. Journal of Earthquake Technology, volume. 41, Paper No. 445, No.1, pp.159-181, March-2004. [15]Srinivasu. A, Dr. Panduranga Rao. B, “Non-Linear Static Analysis of Multi-Storied Building”, International journal of Engineering Trends and Technology, volume. 4, Issue 10, Oct 2013. [14]Sashi K. Kunnat, Erol Kalkan, “Evaluation of Seismic Deformation Demands Using Non-Linear Procedures In multistory Steel and Concrete Moment Frames”, ISTE [16]R. Hasan, L. Xu, D. E. Grierson, “Push-Over Analysis for Performance-Based seismic Design”, Science Direct, 22 July 2002. @ IJTSRD | Unique Paper ID – IJTSRD30961 | Volume – 4 | Issue – 4 | May-June 2020 Page 387