Download
1 / 9
90 likes | 94 Views
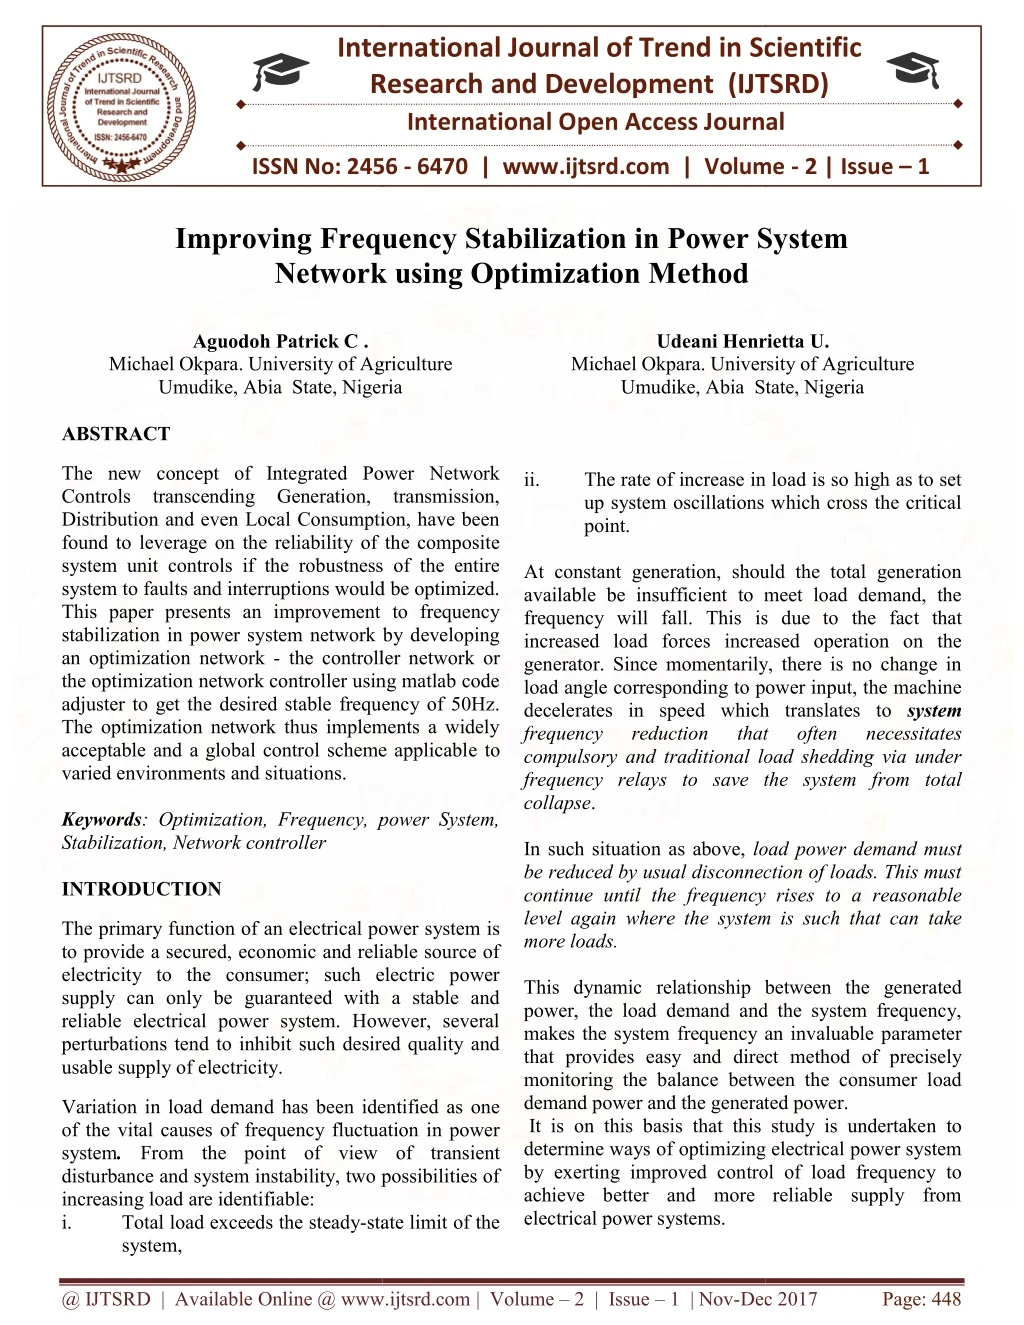
The new concept of Integrated Power Network Controls transcending Generation, transmission, Distribution and even Local Consumption, have been found to leverage on the reliability of the composite system unit controls if the robustness of the entire system to faults and interruptions would be optimized. This paper presents an improvement to frequency stabilization in power system network by developing an optimization network the controller network or the optimization network controller using matlab code adjuster to get the desired stable frequency of 50Hz. The optimization network thus implements a widely acceptable and a global control scheme applicable to varied environments and situations. Aguodoh Patrick C. | Udeani Henrietta U. "Improving Frequency Stabilization in Power System Network using Optimization Method" Published in International Journal of Trend in Scientific Research and Development (ijtsrd), ISSN: 2456-6470, Volume-2 | Issue-1 , December 2017, URL: https://www.ijtsrd.com/papers/ijtsrd7017.pdf Paper URL: http://www.ijtsrd.com/engineering/computer-engineering/7017/improving-frequency-stabilization-in-power-system--network-using-optimization-method/aguodoh--patrick-c<br>

E N D
International Research Research and Development (IJTSRD) International Open Access Journal International Open Access Journal International Journal of Trend in Scientific Scientific (IJTSRD) ISSN No: 2456 - 6470 | www.ijtsrd.com | Volume Frequency Stabilization in Power S ISSN No: 2456 | www.ijtsrd.com | Volume - 2 | Issue – 1 Improving Frequency Network using Optimization M Network using Optimization Method System Aguodoh Patrick C . Michael Okpara. University of Agriculture Umudike, Abia State, Nigeria ABSTRACT Udeani Henrietta U. Michael Okpara. University of Agriculture Umudike, Abia State, Nigeria Udeani Henrietta U. Michael Okpara. University of Agriculture Umudike, Abia State, Nigeria Michael Okpara. University of Agriculture Umudike, Abia State, Nigeria ii. The new concept of Integrated Power Network Controls transcending Generation, transmission, Distribution and even Local Consumption, have been found to leverage on the reliability of the composite system unit controls if the robustness of the entire system to faults and interruptions would be optimized. This paper presents an improvement to frequency stabilization in power system network by developing an optimization network - the controller network or the optimization network controller using matlab code adjuster to get the desired stable frequency of 50Hz. The optimization network thus implements a widely acceptable and a global control scheme applicabl varied environments and situations. Keywords: Optimization, Frequency, power System, Stabilization, Network controller INTRODUCTION The new concept of Integrated Power Network Controls transcending Generation, transmission, Distribution and even Local Consumption, have been leverage on the reliability of the composite system unit controls if the robustness of the entire system to faults and interruptions would be optimized. This paper presents an improvement to frequency stabilization in power system network by developing The rate of increase in load is so high as to set up system oscillations which cross the critical point. At constant generation, should the total generation available be insufficient to meet load demand, the frequency will fall. This is due to the fact that increased load forces increased operation on the generator. Since momentarily, there is no change in load angle corresponding to power input, the machine decelerates in speed which translates to frequency reduction that compulsory and traditional load shedding via under frequency relays to save the system from total collapse. In such situation as above, load power demand must be reduced by usual disconnection of loads. This must continue until the frequency rises to a reasonable level again where the system is such that can take more loads. This dynamic relationship between the generated power, the load demand and the system frequency, makes the system frequency an invaluable parameter that provides easy and direct method of precisely monitoring the balance between the consumer load demand power and the generated power. It is on this basis that this study is undertaken to determine ways of optimizing electrical power system by exerting improved control of load frequency to achieve better and more reliable supply from electrical power systems. The rate of increase in load is so high as to set up system oscillations which cross the critical At constant generation, should the total generation available be insufficient to meet load demand, the is due to the fact that increased load forces increased operation on the generator. Since momentarily, there is no change in load angle corresponding to power input, the machine decelerates in speed which translates to system frequency reduction that compulsory and traditional load shedding via under frequency relays to save the system from total the controller network or the optimization network controller using matlab code adjuster to get the desired stable frequency of 50Hz. The optimization network thus implements a widely acceptable and a global control scheme applicable to ofte often necessitates : Optimization, Frequency, power System, load power demand must be reduced by usual disconnection of loads. This must frequency rises to a reasonable level again where the system is such that can take The primary function of an electrical power system is to provide a secured, economic and reliable source of electricity to the consumer; such electric power supply can only be guaranteed with a stable and reliable electrical power system. However, several perturbations tend to inhibit such desired quality and usable supply of electricity. The primary function of an electrical power system is to provide a secured, economic and reliable source of electricity to the consumer; such electric power supply can only be guaranteed with a stable and reliable electrical power system. However, several perturbations tend to inhibit such desired quality and This dynamic relationship between the generated power, the load demand and the system frequency, makes the system frequency an invaluable parameter s easy and direct method of precisely monitoring the balance between the consumer load demand power and the generated power. It is on this basis that this study is undertaken to determine ways of optimizing electrical power system Variation in load demand has been identified as one of the vital causes of frequency fluctuation in power system. From the point of view of transient disturbance and system instability, two possibilities of increasing load are identifiable: i. Total load exceeds the steady-state l system, d has been identified as one of the vital causes of frequency fluctuation in power From the point of view of transient disturbance and system instability, two possibilities of trol of load frequency to achieve better and more reliable supply from state limit of the @ IJTSRD | Available Online @ www.ijtsrd.com @ IJTSRD | Available Online @ www.ijtsrd.com | Volume – 2 | Issue – 1 | Nov-Dec 2017 Dec 2017 Page: 448
International Journal of Trend in Scientific Research and Development (IJTSRD) ISSN: 2456-6470 e.Excessive vibration of machines, motors and plants f.Low efficiency, poor quality products from production lines and wastages and g.Possible total failure and system collapse among other consequences leading to loss of return on investment and negative impact on the Nation’s GDP. Limitations inherent in previous attempts to control the fluctuation of system frequencies rendered their control actions inadequate in handling all forms of system characteristics (linear and non-linear). A desirable controller must therefore reduce the controller’s response time to its barest minimum. To solve all these problems, the optimization Network Controller is developed to evaluate relevant dynamic characteristics during operation, adjusting control parameters when they occur to ensure convergence of the system state vector to a steady state under a desirable response time and less overshoot. OBJECTIVES BACKGROUND Electric indispensable and integral part of human existence, the numerous advantages and applications of Electric power in our daily operations can really not be over emphasized. As the range of application of Electric Power widens, so does the need for adequate, reliable, effective and efficient control mechanisms. The particular control mechanism that can be developed for the respective system units would be directly dependent on interrelated characteristics of the unit which are identified to include Speed, frequency, voltage, induced current, generated voltage(E), temperature, voltage losses, load size and type among others. Available control techniques based on the above characteristics includes linear controllers, variable structure controllers, Proportional Integral (PID) controllers, gain scheduling controllers etc. The complexity and non- linear load characteristics of large electrical power systems, tend to render them unstable especially in conditions involving non – linear load characteristics. Their unstable transient response to abruptness in system parameters imposes great limitation to their wide application. Besides, they cannot obtain accurate linear time of variant models at variable operating points; consequently, resultant time delays from random disturbances not only reduces system performance but can even cause system instability on frequency and other parameters [Bevani, H., Hiyama, T. 2007]. STATEMENT OF THE PROBLEM Power Generation has become an such operational and and suitably i. To develop a reference mathematical model for the adaptive control configuration that uses optimization, Develop optimization controller network or the optimization network controller using matlab code to confirm( i) To develop optimization matlab code adjuster to get the desired stable frequency of 50Hz Develop optimization networks – the model network or the optimization network plant model To generate frequency stabilized data plant iteratively when (iv) is implemented by matlab simulation To adaptively optimized controller(controller network) using the plant measurement so as to predict the effect of controller changes on plant output, and force the plant output to track the reference model,[ B. Ogbonna, S.N. Ndubisi 2012]. ii. networks – the iii. iv. v. Transient frequency changes (over-frequency and under-frequency) are unavoidable consequences of changes in load power demand in an electrical power system. The unabated propagation of the combined effects of load frequency variations alter the operating point parameter of the system and therefore are adjudged the responsible factor for: vi. network a.High flux density in electrical machines leading to high magnetizing currents b.High core loss, overheating of machines and possible failures c.Abnormally high and low speed of operations of equipment d.Increased fault level RELEVANCE OF THE STUDY Constant frequency is a significant feature of a normally operating system. Realizing a stabilized system frequency is considered very critical due to the fact that: @ IJTSRD | Available Online @ www.ijtsrd.com | Volume – 2 | Issue – 1 | Nov-Dec 2017 Page: 449
International Journal of Trend in Scientific Research and Development (IJTSRD) ISSN: 2456-6470 Most type of AC motors run at speed that are related to the frequency, The operating turbines, particularly steam driven ones, are designed to operate t a very precise speed, The generator turbines particularly steam driven ones, are designed to operate at a very precise speed The overall operation of a power system can be controlled if the frequency error is kept within strict limits A large number of electrically operated clocks are used. They are all driven by synchronous motors, and the accuracy of these clocks is a function not only of the frequency error, but actually of the integral of this error. The overall balance in electrical power system operating frequency would be responsible for efficient and reliable operation of industrial motors and machines which has a far reaching effect in ensuring: Prolonged operating life of the machines, guaranteeing return on investment(both on the power system infrastructures as well as on the industries that run on the product of power system) Flawless and high quality products from the production lines. The standard of such products have direct impact on the nations GDP and the socio- economic wellbeing of the country in general. Finally the study will serve as a reference for both the academia and professionals in the power industry, contributing to the body of knowledge existing on the subject matter. METHODOLGY and the required application for the model.[ Birch, Alan Philip(1988]. Generally a model of a complex system can be obtained by reducing the system under study into smaller, more easily defined blocks. Each block, may then in turn be broken down, and itself modeled as a system, if the internal Characteristics of the system are known. The complexity of each model can be decided upon by considering the use to which the model will be put, and the required accuracy of the result. Also, the complexity of the model will have implications on the time taken to calculate the model, and hence this must be be considered when time is also a constraint on the modeling process. Often a complete description of a system cannot be achieved because of unknown parameters or variables which cannot, or are not measured. Also often the system which is to be described by the model is an extremely complimented and detailed process. (Francoise B., Youssef A. M., Bernard W., 1994) Any system can be modeled to a given degree by carrying out a set of detailed experiments on the plant. The unknown variables in the model can be determined using an exact mathematical description of the system (if known) and this will then represent the plant under all operating conditions. However, in some cases this can be too precise, as what may actually be required is a general model of the system under study. Also, when the plant is in normal operating mode, it may only be subject to a small proportion of the conditions modeled, and certain operations included in the model may not have any effect in this particular operating range. It is known that for most controller designs, -the control is found to be satisfactory, if it is based on a very simple system model which can be obtained over one particular set of operating conditions. The most commonly used approach to find any model is to use data from the actual plant inputs and outputs, when it is operating dynamically within its normal range. However, this on its own causes problems due to the nature of the system. The raw plant data is noisy because of random fluctuations, disturbances and noise introduced by the measuring and telemetry systems used. This process of using data directly gathered from the system under study, including the added noise, to obtain estimates of the parameters of the model of the plant is called System Identification. System identification is therefore, the procedure carried out to model system mathematically, taking The control of a system is made possible if a mathematical model of thesystem under study is already known. If the system has un-modeled dynamicbehaviour, or is totally unknown, then a system model of some form is required.The system model can be calculated fully, or more normally estimated to a given degree. Once a system model has been estimated, it can be used to predict the future behaviour of the plant under study, and hence used as a basis for the calculation of control commands. The type and accuracy of the estimated system model is dependent on the type of system being considered @ IJTSRD | Available Online @ www.ijtsrd.com | Volume – 2 | Issue – 1 | Nov-Dec 2017 Page: 450
International Journal of Trend in Scientific Research and Development (IJTSRD) ISSN: 2456-6470 into consideration the external physical intractable characteristics which are inherent in the system. In realizing the control of frequency in electrical power system, it is of interest therefore: i. To develop a reference mathematical model for the adaptive control configuration that uses optimization, ii. Develop optimization controller network or the optimization network controller using matlab code to confirm( i) iii. To develop optimization matlab code adjuster to get the desired stable frequency of 50Hz iv. Develop optimization networks – the model network or the optimization network plant model v. V. To generate frequency stabilized data plant iteratively when (iv) is implemented by matlab simulation vi. To adaptively controller(controller network) using the plant measurement so as to predict the effect of controller changes on plant output, and force the plant output to track the reference model, [ B. Ogbonna, S.N. Ndubisi 2012]. . 2 To develop a reference model for the adaptive control configuration that uses optimization. An EEDC company produces two types of power supply A and B that require frequencies F1 and F2. Each unit of type A require 1Hz of F1 and 2Hz of F2.Type B requires 2Hz of F1 and 1Hz of F2 (Each unit).The company has only 100Hz of F1 and 80Hz of F2. Each unit of type A brings a profit of #500 and each unit of type B brings a profit of #400. Formulate the optimization problem to maximize profit that will stabilize the frequency. SOLUTION Objective function: The given problem is aimed at maximizing profit. Let Z be the objective function profit of each unit of type A = #500, That is profit of x unit of type A = #500x. Profit of each unit of type B = #400, That is profit of y unit of type B = #400y. Total profit = 500x + 400y.--------------------------- 1 Constraints (i): Company has only 100Hz of F1 Unit of A requires 1Hz of F1, That is x-unit requires x-Hz of F1. 1 unit of B requires 2Hz of F1. Thus y-unit requires 2y-Hz of F1 Thus total available quantity of F1 for A and B = 100Hz Therefore x + 2y <= 100--------------------------- 2 Constraint (ii): Company has only 80Hz of F2. 1 Unit of A requires 2Hz of F2. Thus x- unit requires 2x – Hz 1 Unit of B requires 1Hz of F2. Thus y – units requires y – Hz. Total available quantity of F2 for A and B = 80 Hz. That is 2x + y <= 80.----------------------------------- 3 Constraint (iii): Supply of A and B cannot be negative, That is x >= 0 and y >= 0 The mathematical model improving frequency stabilization in power system network using optimization method becomes Maximize Z = 500x + 400y--------------------------- 4 Subject to x + 2y <= 100------------------------------ 5 2x + y <= 80------------------------------ 6 x >= 0 and y >= 0 Then use simplex method mathematical model of equations 4, 5 and 6 z = 500x + 400y------------------------ 7 x + 2y <= 100-------------------------- 8 2x + y <= 80---------------------------- 9 Equate equation 3.2.7 to zero and remove all the constraints in equations 8 and 9 respectively by introducing slacks Z – 500x – 400y = 0------------------ 10 x + 2y + S1 = 100--------------------- 11 2x + y + S2 = 80---------------------- 12 networks – the optimized network formulation for to solve the Table 1: To give the information in a tabular form as shown below Frequencies F1 (Hz) F2 (Hz) Profit (#) 500 400 A B Decision variable: The decision variable are frequencies A and B. Thus let the number of frequency A be x while that of B is y. 1 2 100 2 1 80 @ IJTSRD | Available Online @ www.ijtsrd.com | Volume – 2 | Issue – 1 | Nov-Dec 2017 Page: 451
International Journal of Trend in Scientific Research and Development (IJTSRD) ISSN: 2456-6470 No of iterations iter 1 S2 leaves x enters Basic Z X y S1 S2 Sol z S1 S2 1 0 0 -500 1 2 -400 0 2 1 0 0 1 0 100 80 1 0 Iter 2 Iter 3 Power z = 26000 frequency F1 = 20 Hz Frequency F2 = 40 Hz Step2 To find the key column go for the most negative in the z row which is -500 Step 3 To find the key row use the positive numbers in the key column to divide their respective solutions which ever gives the smaller answer is where the key row falls 100/1 = 100, 80/2 = 40 Step 4: To fill the pivot row x use the number that is at the point of intersection in the key row and key column of iteration 1 which is 2 to divide all the numbers in S2 row of iteration1. z = 0/2 = 0, x = 2/2 = 1,y=1/2 = 1/2,S1 = 0/2 = 0,S2 = 1/2= 1/2, Sol = 80/2 = 40 Step 5; To fill the 2 row of iteration 2.Recall new No = old NO – (pivot No x Constant) z= 1 –(0 x -500) = 1 x = -500 –(1x-500) = -500+500 =0 y = -400 –(1/2x-500) = -400+250 = -150 s1 = 0 – (0x-500) = 0 s2 = 0 – (1/2 x -500) = 0 + 250 =250 sol = 0 – (40 x -500) = 20000 Step 6 To fill s1 row of iteration 2. z = 0 – (0x1) = 0 x = 1 – (1x1) = 0 y = 2- (1/2x1) = 2 -1/2 = 4-1/2 =3/2 s1 = 1 – (0x1) = 1 s2 = 0 – (1/2x1) = -1/2 sol = 100 – (40x1) = 60 Step 7 To find the key row in iteration 2 60/3/2= 60/1 x2/3 = 40 40/1/2 = 40/1 x 2/1 = 80 Step 8 To fill the pivot row of iteration 3 z = 0/3/2 = 0 x = 0/3/2 = 0 y = 3/2/3/2 =3/2 x 2/3 =1 s1 = 1/3/2 = 1/1 x 2/3 =2/3 sol = 60/3/2 = 60/1 x 2/3 = 40 Step 9 To fill the 2 row of iteration3 z = 1 –(0 x -150) = 1 z S1 x 1 0 0 0 0 1 -150 3/2 ½ 0 1 0 ½ 250 -1/2 20000 60 40 z y x 1 0 0 0 0 1 0 1 0 100 2/3 -1/3 200 -1/3 2/3 26000 40 20 @ IJTSRD | Available Online @ www.ijtsrd.com | Volume – 2 | Issue – 1 | Nov-Dec 2017 Page: 452
International Journal of Trend in Scientific Research and Development (IJTSRD) ISSN: 2456-6470 x = 0 –(0 x -150) = 0 y = -150 – (1 x -150) = -150+150 = 0 s1 = 0 – (2/3 x – 150) = 0 + 100 = 100 s2 = 250 – (-1/3 x -150) 250 – 50 = 200 Sol = 20000 – ( 40 x 150) 20000 + 6000 = 26000 Step 10 To fill x row of iteration 3 z = 0 –(0 x 1/2) = 0 x = 1 – (0 x 1/2) = 1 y = 1/2 –(1 x 1/2) = ½ - ½ = 0 s1 = 0 – (2/3 x ½) = - 1/3 s2 = ½ - ( -1/3 x ½) = ½ +1/6 =2/8 = 3+1/6 =4/6 =2/3 Sol = 40 –(40 x 1/2) = 40 -20 = 20 3. Develop optimization networks – the controller network or the optimization network controller using matlab code to confirm( i) Table 2. values of frequency(Hz) vs Power(mw) for constant R. ∆ ƒ 15.8 15.5 14.0 11.95 9.6 9.2 8.1 7.3 6.5 6.1 5.7 5.3 4.9 PL(MW) 6.15 6.43 6.96 7.77 8.74 8.91 9.39 9.72 10.04 10.20 10.36 10.53 10.69 For a linear situation at R = constant say = 0.04% 0r 204 pu (H2) mw, the plot of ∆L was called out using the following mat lab codes, while the figure below shows the straight line graph with a negative slope. %-- 10/3/15 2:40 PM --% >> % plot of static frequency vs power respone under constant R; >>pl=[6.15 6.96 7.77 8.74 8.91 9.39 9.72 10.04 10.20 10.36 10.53]; >> f=[15.8 14.0 11.95 9.6 9.2 8.1 7.3 6.5 6.1 5.7 5.3]; >> plot(pl,f); grid on; xlabel('Power(p)');ylabel('Frequency(Hz)');title('F-Pl response at constant R' Fig 1: System response under variable regulation Parameter. Also a non linear situation (non constant regulation parameter) where R is variable, different values of R were generated from say 0-2 putted/mw insteps of 0.05 and used to compute corresponding values of ∆f from the relation ∆f0 = R∆PL with PL (mw) values as in table in table 9. The new table of table of non-linear values is shown in table 4.2. Again the graph of the non-linear values of ∆f and PL is plotted, the downward parabolic response in shown in figure 4.2 @ IJTSRD | Available Online @ www.ijtsrd.com | Volume – 2 | Issue – 1 | Nov-Dec 2017 Page: 453
International Journal of Trend in Scientific Research and Development (IJTSRD) ISSN: 2456-6470 Table 3: values of frequency(Hz) vs Power(mw) for variable R 3.48 3.497 3.1185 2.817 6.96 8.74 8.91 9.39 ∆ ƒ PL(MW) 3.38 6.15 2.43 9.72 2.008 10.04 1.53 10.20 1.036 10.36 0.526 10.53 % 10/3/15 7:47 PM --% >> % plot of frequency vs power respone under variable R; >>pl=[6.15 6.96 8.74 8.91 9.39 9.72 10.04 10.20 10.36 10.53]; >> f=[3.38 3.48 3.4965 3.1185 2.817 2.43 2.008 1.53 1.036 0.526]; >>plot(pl,f); grid on; xlabel('Power(p)'); ylabel('Frequency(Hz)'); title('F-Pl response at variablr R') Optimization network controller action is founded upon the basis of non-linear regulation parameter (R) or factor of the turbine power in this circumstance. This parameter is as noted earlier is obtained from the observed relationship between the system frequency ∆f(0) and the turbine output power, also drawing from the relationship between the frequency and load power taken from the system during load variation. 100% to + 100%. Fig.1 shows the frequency fluctuation at the output of the power unit when a 10% step load increase occurs on the bus. Table 4: SIMULATED DATA Frequency Time 0 0 82 0.3 25 0.8 69 1 38 1.4 60 1.8 43 2 55 2.3 50 5 50 10 Figure 2 Frequency – power response under variable Regulation Parameter R @ IJTSRD | Available Online @ www.ijtsrd.com | Volume – 2 | Issue – 1 | Nov-Dec 2017 Page: 454
International Journal of Trend in Scientific Research and Development (IJTSRD) ISSN: 2456-6470 Fig 3 SIMULATED FREQUENCY VS TIME RESULT Fig 3 Shows the simulated frequency vs Time .It shows that the frequency becomes stable at a coordinated frequency vs time of (50,5) to (50,10).This indicates that there will be stable power supply to the consumers. CONCLUSION 4.Chaturvedi D.K. Modeling and simulation of power system: an alternative approach. Thesis for the Degree of Doctor of philosophy, Dayaibagh Educational Institute Dayalhagh, Agra, India. 1997. Optimization networks have been successfully applied to control the turbine reference power of a computer – simulated generator unit. The optimization networks have been adapted using back propagation. Through – time algorithm. By the adaptive method (where control action is based on decisions taken by the remembering information already stored or learnt in the system control unit) employed in this paper, frequency variations in a single – area system was inputted into the optimization network controller. The optimization network thus implements a widely acceptable and a global control scheme applicable to varied environments and situations. It is found very suitable for controlling the plant dynamics in relatively less time. (Deemed University), 5.Chaturveli D. K., Satsagi P.S., Kara P.K. Short term load forecasting using generalized neural network approach. Journal of the Institution of Engineers (India), 78(2), 1997, 83-87. 6.Weedy, B.M, Electric Power Systems, Courier International limited, Tiptree, Essex; 1989 7.M.F. Hassan, A.A. Abouelsoud, H.M. Soliman. Constrained load frequency control. Electric power components and system, 36, 2008, pp. 266279. REFERENCES 8.H. Shayeghi, SHAYANFAR. Application of ANN technique based on l-synthesis to load frequency control of interconnected power system. Electrical power and Energy System, 28, 2006, pp 503511. 1.Bevani H., Hiyama T. Robust load frequency regulation: A real-time laboratory experiment. Optimum Control Application, 28, 2007, 419-433. 2.Unbehaven, H., Kocaarslan, I. Experimental modeling and adaptive power control of a 750MW once-through boiler. Proceeding of 11th IFAC World Congress. Talin, SU, 13-17 August 1990, vol. 4, pp 226-231. 9.Birch, Alan Philip(1988)Adaptive load frequency control of electrical power systems, Durham thesis, Durham University online E-Theses. http://etheses.dur.ac.uk/6448/ 10.B. Ogbonna, S.N. Ndubisi. Neural Network Based Load Frequency Control For Restructuring Power Industry, Nigerian Journal (NIJOTECH) Vol. 31, No. 1, March, 2012 3.Change C.S., Fu W.,Wen F. Load frequency controller using generic algorithm based fuzzy gain scheduling of P1 controller. Electric machines and power systems, 26, 1998, 39-52. of Technology 11.GUO, Estimation of Power System Dynamic Models SONG (2014) Adaptive Parameter @ IJTSRD | Available Online @ www.ijtsrd.com | Volume – 2 | Issue – 1 | Nov-Dec 2017 Page: 455
International Journal of Trend in Scientific Research and Development (IJTSRD) ISSN: 2456-6470 Using Modal Information, Durham theses, Durham University. Theses.http://etheses.dur.ac.uk/10576/ Durham on-line E- 12.P.M. and Fouad, A.A. (1997). Power System Control and Stability, Ames Iowa State university Press. HadiSaadal. Power System Analysis. McGraw-Hill 2002. 13.Chaturvedi D.K. Modeling and Simulation of Power System, an Alternative Approach. Thesis for the Degree of Doctor of Philosophy, Dayaibagh Educational University, DayalHagh, Agra. India 1997. Institute, Redeemed 14.Werbos, P.J. (1990) Back Propagation through Time; what it does and how to do it (special issue on neural networks). Proceedings of IEEE, 2, 1550 – 1560. 15.Hung T. Nguyeu; Nadipuram R. Prasad Carol L. Walker, Elbert, A. Walker; A First Course in Fuzzy and Neural Control; Chapman and Hall C.R.C press Company, New York, 2003. 16.Change C.S., Fu W.,Wen F. Load frequency controller using gene lie algorithm based fuzzy gain scheduling of P1 controller. Electric machines and power systems, 26, 1998, 39-52. 17.T. Söderström Identification, Englewood Cliffs, NJ, Prentice Hall, 1989. and P. Stoica, System 18.L. Ljung and T. Glad, Modeling of Dynamic Systems, Englewood Cliffs, NJ, Prentice Hall, 1994. 19.R. Johansson, System Modeling and Identification, Englewood Cliffs, NJ, Prentice Hall, 1993. 20.L. Ljung, System Identification: Theory for the User, 2nd ed., Englewood Cliffs, NJ, Prentice Hall, 1999. 21.Roadmap to Power sector Reforms; presidential Policy Publication on Power sector Reforms in Nigeria, 2010. 22.J. Sjöberg et al., “Non-Linear Black-Box Modeling in System Identification: A Unified Overview”, Automatica, (12), 1995, pp. 1691– 1724. @ IJTSRD | Available Online @ www.ijtsrd.com | Volume – 2 | Issue – 1 | Nov-Dec 2017 Page: 456