Download
1 / 10
100 likes | 110 Views
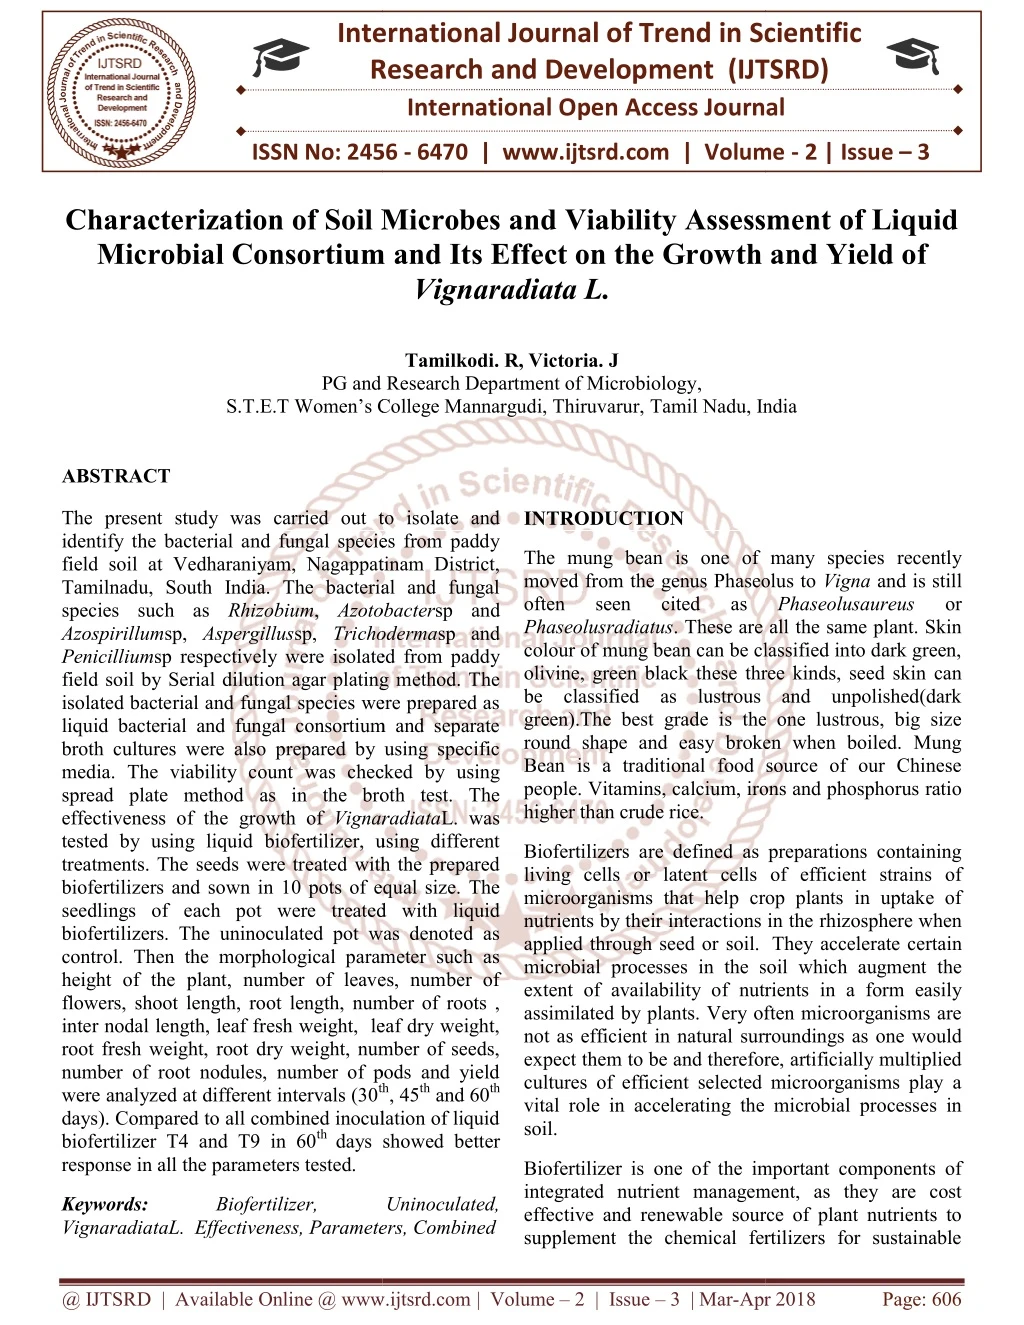
The present study was carried out to isolate and identify the bacterial and fungal species from paddy field soil at Vedharaniyam, Nagappatinam District, Tamilnadu, South India. The bacterial and fungal species such as Rhizobium, Azotobactersp and Azospirillumsp, Aspergillussp, Trichodermasp and Penicilliumsp respectively were isolated from paddy field soil by Serial dilution agar plating method. The isolated bacterial and fungal species were prepared as liquid bacterial and fungal consortium and separate broth cultures were also prepared by using specific media. The viability count was checked by using spread plate method as in the broth test. The effectiveness of the growth of VignaradiataL. was tested by using liquid biofertilizer, using different treatments. The seeds were treated with the prepared biofertilizers and sown in 10 pots of equal size. The seedlings of each pot were treated with liquid biofertilizers. The uninoculated pot was denoted as control. Then the morphological parameter such as height of the plant, number of leaves, number of flowers, shoot length, root length, number of roots , inter nodal length, leaf fresh weight, leaf dry weight, root fresh weight, root dry weight, number of seeds, number of root nodules, number of pods and yield were analyzed at different intervals 30th, 45th and 60th days . Compared to all combined inoculation of liquid biofertilizer T4 and T9 in 60th days showed better response in all the parameters tested. Tamilkodi. R | Victoria. J "Characterization of Soil Microbes and Viability Assessment of Liquid Microbial Consortium and Its Effect on the Growth and Yield of Vignaradiata L." Published in International Journal of Trend in Scientific Research and Development (ijtsrd), ISSN: 2456-6470, Volume-2 | Issue-3 , April 2018, URL: https://www.ijtsrd.com/papers/ijtsrd4719.pdf Paper URL: http://www.ijtsrd.com/biological-science/microbiology/4719/characterization-of-soil-microbes-and-viability-assessment-of-liquid-microbial-consortium-and-its-effect-on-the-growth-and-yield-of-vignaradiata-l/tamilkodi-r<br>

E N D
International Research Research and Development (IJTSRD) International Open Access Journal f Soil Microbes and Viability Assessment Microbial Consortium and Its Effect on the Growth Vignaradiata L. International Journal of Trend in Scientific Scientific (IJTSRD) Access Journal ISSN No: 2456 ISSN No: 2456 - 6470 | www.ijtsrd.com | Volume 6470 | www.ijtsrd.com | Volume - 2 | Issue – 3 Characterization of Soil Microbes Microbial Consortium nd Viability Assessment of Liquid he Growth and Yield of Tamilkodi. R, Victoria. J PG and Research Department of Microbiology, PG and Research Department of Microbiology S.T.E.T Women’s College Mannargudi, Thiruvarur, S.T.E.T Women’s College Mannargudi, Thiruvarur, Tamil Nadu, India Tamil Nadu, India ABSTRACT The present study was carried out to isolate and identify the bacterial and fungal species from paddy field soil at Vedharaniyam, Nagappatinam District, Tamilnadu, South India. The bacterial and fungal species such as Rhizobium, Azotobacter Azospirillumsp, Aspergillussp, Trichoderma Penicilliumsp respectively were isolated from paddy field soil by Serial dilution agar plating method. The isolated bacterial and fungal species were prepared as liquid bacterial and fungal consortium and separate broth cultures were also prepared by using specific media. The viability count was checked by using spread plate method as in the broth test. The effectiveness of the growth of Vignaradiata tested by using liquid biofertilizer, using different treatments. The seeds were treated with the prepared biofertilizers and sown in 10 pots of equal size. The seedlings of each pot were treated with liquid biofertilizers. The uninoculated pot was denoted as control. Then the morphological parameter such as height of the plant, number of leaves, number of flowers, shoot length, root length, number of roots , inter nodal length, leaf fresh weight, leaf dry weight, root fresh weight, root dry weight, number of seeds, number of root nodules, number of pods and yield were analyzed at different intervals (30th days). Compared to all combined inoculation of liquid biofertilizer T4 and T9 in 60th days showed better response in all the parameters tested. The present study was carried out to isolate and identify the bacterial and fungal species from paddy field soil at Vedharaniyam, Nagappatinam District, Tamilnadu, South India. The bacterial and fungal INTRODUCTION e mung bean is one of many species recently moved from the genus Phaseolus to Vigna and is still often seen cited as . These are all the same plant. Skin colour of mung bean can be classified into dark green, een black these three kinds, seed skin can be classified as lustrous and unpolished(dark green).The best grade is the one lustrous, big size round shape and easy broken when boiled. Mung Bean is a traditional food source of our Chinese lcium, irons and phosphorus ratio The mung bean is one of many species recently moved from the genus Phaseolus to often seen cited as Phaseolusradiatus. These are all the same plant. Skin colour of mung bean can be classified into dark green, olivine, green black these three kinds, seed skin can be classified as lustrous and unpolished(dark green).The best grade is the one lustrous, big size round shape and easy broken when boiled. Mung Bean is a traditional food source of our Chinese people. Vitamins, calcium, irons and phosphorus ratio higher than crude rice. Phaseolusaureus or Azotobactersp and Trichodermasp and sp respectively were isolated from paddy field soil by Serial dilution agar plating method. The isolated bacterial and fungal species were prepared as liquid bacterial and fungal consortium and separate broth cultures were also prepared by using specific edia. The viability count was checked by using spread plate method as in the broth test. The VignaradiataL. was tested by using liquid biofertilizer, using different treatments. The seeds were treated with the prepared tilizers and sown in 10 pots of equal size. The seedlings of each pot were treated with liquid biofertilizers. The uninoculated pot was denoted as control. Then the morphological parameter such as height of the plant, number of leaves, number of hoot length, root length, number of roots , inter nodal length, leaf fresh weight, leaf dry weight, root fresh weight, root dry weight, number of seeds, number of root nodules, number of pods and yield Biofertilizers are defined as preparations containing living cells or latent cells of efficient strains of microorganisms that help crop plants in uptake of nutrients by their interactions in the rhizosphere when Biofertilizers are defined as preparations containing living cells or latent cells of efficient strains of microorganisms that help crop plants in uptake of nutrients by their interactions in the applied through seed or soil. microbial processes in the soil which augment the extent of availability of nutrients in a form easily assimilated by plants. Very often microorganisms are not as efficient in natural surroundings as one would expect them to be and therefore, artificially multiplied cultures of efficient selected microorganisms play a vital role in accelerating the microbial processes in soil. They accelerate certain microbial processes in the soil which augment the extent of availability of nutrients in a form easily assimilated by plants. Very often microorganisms are surroundings as one would expect them to be and therefore, artificially multiplied cultures of efficient selected microorganisms play a vital role in accelerating the microbial processes in th, 45th and 60th days). Compared to all combined inoculation of liquid days showed better Biofertilizer is one of the important components of integrated nutrient management, as they are cost effective and renewable source of plant nutrients to supplement the chemical fertilizers for sustainable supplement the chemical fertilizers for sustainable Biofertilizer is one of the important components of ed nutrient management, as they are cost effective and renewable source of plant nutrients to Keywords: VignaradiataL. Effectiveness, Parameters, Combined VignaradiataL. Effectiveness, Parameters, Combined Biofertilizer, Biofertilizer, Uninoculated, Uninoculated, @ IJTSRD | Available Online @ www.ijtsrd.com @ IJTSRD | Available Online @ www.ijtsrd.com | Volume – 2 | Issue – 3 | Mar-Apr 2018 Apr 2018 Page: 606
International Journal of Trend in Scientific Research and Development (IJTSRD) ISSN: 2456-6470 agriculture. Several microorganisms and their association with crop plants are being exploited in the production of biofertilizers. They can be grouped in different ways based on their nature and function. The need for the use of biofertilzers has arisen, primarily because of two reasons. The increased usage of chemical fertilizers leads to damage in soil texture and raises other environmental problems. Therefore, the use of biofertilzers is both economical and environment friendly. widespread AspergillusandTrichodermaspecies. number of biofertilizers available in the market. However, applications are based on their ability to supply and mobilize plant nutrients, control plant diseases and promote plant growth and development. fungi are Penicillium, There are a The mung bean or green gram is one of many species recently moved from the genus Phaseolus to Vigna and is still often seen cited as Phaseolusaureus or Phaseolusradiatus. These are all the same plant. Skin colour of mung bean can be classified into dark green, olivine, green black these three kinds, seed skin can be classified as lustrous and unpolished(dark green). The best grade is the one lustrous, big size round shape and easy broken when boiled. Mung Bean is a traditional food source of our Chinese people. Vitamins, calcium, irons and phosphorus ratio higher than crude rice. Liquid Biofertilizers Liquid requirements to preserve organisms and deliver them to the target regions to improve their biological activity or a consortium of microorganisms provided with suitable medium to keep up their viability for certain period which aids in enhancing the biological activity of the target site. Liquid formulation is a budding technology in India and has very specific characteristics and uniqueness in its production methods. Liquid biofertilizers are the microbial preparations containing microorganisms which are capable of fixing or solubilizing or mobilizing plant nutrients by their biological activity. biofertilizers preparation comprises MATERIALS AND METHODS Soil samples were collected from paddy field at Vedharaniyam, Nagappatinam District, Tamilnadu, South India.Soil samples were taken from each container and subjected to serial dilution followed by pour plate method. Bacterial species were identified by Gram’s staining, motility and biochemical tests. Fungal species were identify the by Lacto phenol cotton blue staining.Identified bacterial species such as Rhizobiumsp, Azospirillumsp, Azotobacterspand fungal species Penicilliumsp, Trichoderma sp. specific beneficial Bacterial Biofertilizer Many rhizospheric bacterial strains possess plant growth-promoting mechanisms. These bacteria can be applied as biofertilizers in agriculture and forestry, enhancing crop yields. Bacterial biofertilizers can improve plant growth through several different mechanisms. Several rhizobacteria (PGPR) have been used worldwide for many years as biofertilizers, contributing to increase in crop yields and soil fertility and hence, having the potential to contribute to more sustainable agriculture and forestry. The technologies for the production and application of bacterial inoculum are under constant development and improvement and the bacterial- based biofertilizer market is growing steadily. Aspergillusspand Preparation of Bacterial and Fungal Liquid Biofertilizer plant growth-promoting Prepared bacterial and fungal starter culture byspecific medium. Nutrient broth was used for bacteria and Rose Bengal broth was used for fungi.50ml broth of all three bacteria Rhizobiumsp, Azotobactersp and Azospirillumsp as a liquid bio- fertilizer was prepared.Three broths were mixed and shakevigorously; this mixture was again incubated for 2 days. Now this broth was called liquid bacterial consortium. 50ml broth Penicilliumsp, Aspergillusspand Trichodermasp as a liquid bio-fertilizer was prepared. Three broths were mixed and shake vigorously; this mixture was again incubated for 10 days. Now this broth was called liquid fungal consortium. of all three fungi Fungal Biofertilizers Fungal biofertilizers comprise fungal inoculum either alone or in combination, exerting direct or indirect benefits on plant growth and crop yield through different mechanisms. Fungal biofertilizers, which have been used to improve plant growth by enhancing phosphorus absorption in plants, are phosphate solubilizing microorganisms. The commonly @ IJTSRD | Available Online @ www.ijtsrd.com | Volume – 2 | Issue – 3 | Mar-Apr 2018 Page: 607
International Journal of Trend in Scientific Research and Development (IJTSRD) ISSN: 2456-6470 5 was spread over the nutrient agar plates. The plates were incubated in incubator at 37ºC for 7 days. The number of cells(ml) present in 0.1 ml of broth was determined by multiplying total number of colonies with dilution factor. Confirmatory test for bacteria Confirmatory test were done to identify the presence or absence of specific bacteria in the liquid bacterial consortium. Confirmatory Test for Rhizobium s No of cells\ml = ???? ?? ?? ???????? ?????? ?? ???????? × dilution factor LactoseAgar Test Testing the Efficiency of liquid biofertilizer Rhizobium spwas spread out on agar medium containing lactose (10 g\1). The plates were flooded with Benedict’s reagent after 4-10 days. The growth of Rhizobiumspin this medium was absent. This indicated the confirmation of Rhizobium sp. Pot Culture The efficiency of liquid biofertilizers on the growth and yield of VignaradiataL.was studied using 8 different bacterial and fungal liquid formulations and an uninoculated control for each also maintained. Confirmatory Test for Azospirillumsp The bacterial liquid formulation treatments were, Pellicle Test T1 T2 T3 T4 Azotobactersp T5 The fungal liquid formulation treatments were, T6 – Aspergillussp T7 – Trichodermasp T8 – Penicilliumsp T9 – Aspergillussp + Trichodermasp + Penicilliumsp T10 – Control The seeds were treated with the prepared biofertilizers and sown in 10 pots of equal size. The seedlings of each pot were treated with liquid biofertilizers. The uninoculated pot was denoted as control. Liquid biofertilizer was sprayed on plants at 10 days intervals. The morphometric parameters height of the plant (in cm), number of leaves (per plant), number of flowers (per plant), shoot length (in cm), root length (in cm), number of roots (per plant), inter nodal length (in cm), leaf fresh weight (mg\plant), leaf dry weight (mg\plant) , root fresh weight (mg\plant), root dry weight (mg\plant), number of seeds (in plant), number of root nodules (per plant), number of pods (per plant) and yield (seed in gram) was measured at 30th, 45th and 60th days of growth. – – – – Rhizobium sp Azospirillumsp Azotobactersp Rhizobium sp + Azospirillumsp + The active Azospirillumspisolates were inoculated at subsurface level in screw cap tubes containing sterilized semisolid N- free malate medium (Okonet al., 1977) under aseptic conditions. The tubes were incubated at 30ºC for a period of one week and observed for growth of Azospirillumspas subsurface pellicle. – Control Confirmatory Test for Azotobactersp Cyst formation Azotobactersp have ability to form cysts under adverse conditions. Presence of cyst is as one of the criterion for identification of these isolates. The Azotobacterspisolates were grown N-free agar medium for 7 days. These isolates were stained with a mixture of neutral red and light green SF yellowish, observed under oil immersion microscope. Mass Production of Liquid Biofertilizer Theisolatedstains were grown in respective broth medium in culture tube. After checking the culture for purity and proper growth, the culture was transferred from culture tube to small conical flask containing sterilized liquid medium as starter culture. Later the starter culture was transferred to a large conical flask on a rotary shaker at 150 rpm for 5 days at 28±2ºC. Viability Count Statistical Analysis (Gupta, 2004) The number of living cells was counted by spread plate method. Doing spread plate by making serial dilutions from 10-1 to 10-7 (depend on concentrations) then the replicates of 0.1 ml of broth from 10-6 and 10- All the experiment was repeated as triplicates. The result obtained in the present study was subjected to @ IJTSRD | Available Online @ www.ijtsrd.com | Volume – 2 | Issue – 3 | Mar-Apr 2018 Page: 608
International Journal of Trend in Scientific Research and Development (IJTSRD) ISSN: 2456-6470 statistical analysis such as Mean (X) and Standard Deviation (SD). The standard deviation calculated by the formula, 2) X ?∑(?? Mean (X) = ∑? ? S.D = ??? Where, Where, X- Arithmetic mean, X – Number of all values and N- Total number of observation. Find out Mean (X) – Sum of all values of the variable X ) the deviation of each value from the mean (X- square the deviation and take the total of square deviation. Divide the total number of observation. N – Number of observation. Where, add together all values of variable X and obtain X- X. Divide the total by the number of observation. Table:1 Morphological and Biochemical Characteristics of Isolated Bacteria S.No Characteristics Rhizobium sp Azospirillumsp Azotobactersp Morphological Characteristics 1. Gram Staining 2. Motility _ Motile _ Motile + Motile Shape Rod Rod Spherical 3. Biochemical Characteristics 4. Indole 5. MR 6. VP + + _ _ _ _ + + _ Citrate _ 7. _ + Catalase Triple Sugar Iron Carbohydrate Fermentation + + _ + + + + + + 8. 9. 10. (+) – Positive ,(-) – Negative Table : 2 Colonial and Morphological Characteristics of IsolatedFungi S. No 1. Organisms Aspergillussp Penicilliumsp Trichodermasp Colony Morphology Blackish brown Bluish green to clear green White to pink Microscopic Observation Hyphae septate with conidiospore 2. Aerial hyphae with conidiospore 3. Two celled conidia @ IJTSRD | Available Online @ www.ijtsrd.com | Volume – 2 | Issue – 3 | Mar-Apr 2018 Page: 609
International Journal of Trend in Scientific Research and Development (IJTSRD) ISSN: 2456-6470 Table : 3 Details of Viability Count of bacteria (CFU\ml) Storage time (in months) 0 1 1.9 × 10⁷ 2.3 × 10⁶ Species Rhizobium sp 2 3 2.5 × 10⁵ 3 × 10⁵ 2 × 10⁶ 1.8 × 10⁵ 1.9 × 10⁵ 1.2 × 10⁵ 1.5 × 10⁶ 1.7 × 10⁷ 1.25 × 10⁶ 3 × 10⁸ Azospirillumsp Azotobactersp Table: 4 Details of Viability Count of fungi (CFU\ml) Storage time (in months) 0 1 2 × 10⁷ 1.2 × 10⁶ 1.5 × 10⁷ 1.9 × 10⁷ Species Aspergillussp Penicilliumsp Trichodermasp 2 3 1.3 × 10⁶ 3.5 × 10⁵ 1.9 × 10⁶ 1.7 × 10⁶ 2.8 × 10⁵ 3.4 × 10⁵ 2.5 × 10⁵ 2.5 × 10⁷ Table: 5 Effect of liquid biofertilizer on morphological parameters of VignaradiataL . (30th day) Treatments Morphological Parameters Height of the plant (in cm) Inter length (in cm) Number leaves plant) Leaf weight (mg\plant) T1 T2 T3 T4 T5 T6 T7 T8 T9 T10 10±5.1 9±3.3 9±4.5 4±2.3 8±2.2 9±2.2 8±3.4 9±2.5 13±2.5 7±2.2 nodal 4±5.1 4±3.4 4±4.2 5±4.2 3±2.1 4±2.5 3±9.2 4±3.2 5±2.5 3±2.3 of 9±2.1 7±2.3 (per 9±0.2 9±1.5 9±4.5 7±1.2 8±3.5 8±1.2 8±4.5 9±3.2 fresh 8±7.5 8±5.7 8±6.8 8±9.5 6±2.5 7±2.5 7±1.2 7±5.9 8±8.2 6±5.2 Leaf dry weight (mg\plant) 6±6.5 6±4.1 6±5.5 6±8.5 5±1.5 6±3.2 6±1.5 6±2.8 6±7.2 5±4.9 Number of root nodules (per plant) Shoot length (in cm) Root length (in cm) Root weight (mg\plant) Root dry weight (mg\plant) 4±2.2 6±4.5 5±2.6 5±2.8 7±6.5 4±1.2 5±2.5 4±2.5 5±2.6 7±5.7 7±1.4 4±9.5 5±1.5 7±2.1 3±1.5 4±4.2 4±1.5 4±9.5 7±1.4 3±3.8 5±3.5 5±4.5 5±4.2 7±1.2 4±1.5 5±3.5 4±4.5 5±4.2 6±4.5 4±3.5 fresh 5±4.9 8±8.5 7±4.5 8±2.3 9±9.5 5±1.5 6±4.9 6±1.3 7±1.5 9±1.5 7±2.5 6±5.4 7±1.2 7±4.2 5±2.2 6±3.2 6±2.1 6±4.1 7±3.8 5±3.5 @ IJTSRD | Available Online @ www.ijtsrd.com | Volume – 2 | Issue – 3 | Mar-Apr 2018 Page: 610
International Journal of Trend in Scientific Research and Development (IJTSRD) ISSN: 2456-6470 Table :6 Effect of liquid biofertilizer on morphological parameters of VignaradiataL. (45th day) Morphological Parameters Treatments T1 12±5.1 6±4.2 T2 11±2.2 T3 11±0.5 T4 16±2.4 T5 8±2.7 T6 9±4.5 T7 9±3.5 T8 10±2.1 T9 15±2.6 6±5.8 T10 8±8.2 4±9.5 8±2.8 Height of the plant (in cm) 5±2.5 6±2.9 7±4.5 4±2.9 5±3.7 4±3.6 5±8.4 Inter length (in cm) Number leaves (per plant) Leaf weight (mg\plant) Leaf weight (mg\plant) Number root nodules (per plant) Shoot length (in cm) nodal 11±2.3 10±4.9 11±1.5 12±2.3 8±4.9 9±5.2 9±2.5 6±7.2 9±3.5 10±2.5 11±4.9 of 11±3.9 11±1.2 11±2.2 12±2.5 9±5.6 7±1.5 9±1.5 10±9.2 12±1.2 7±5.5 fresh 8±3.8 7±4.9 8±2.5 5±2.5 6±2.2 7±5.6 9±4.9 5±5.9 dry 7±4.7 6±8.9 7±2.7 8±6.7 5±1.5 6±2.4 6±0.6 6±8.8 8±5.9 5±4.2 of 7±3.2 6±2.5 5±2.8 8±1.2 8±5.7 3±6.8 4±8.5 5±6.8 4±4.5 5±0.2 7±8.2 3±8.2 4±5.3 7±3.1 6±4.2 6±0.8 6±1.5 4±4.3 5±5.5 5±7.5 8±4.5 Root length (in cm) 10±2.5 9±1.5 9±2.3 9±4.5 10±5.6 6±4.2 8±2.6 7±4.9 8±4.5 10±4.5 Root weight (mg\plant) Root weight (mg\plant) Number flowers (per plant) fresh 8±1.2 8±2.6 9±4.5 6±3.1 7±3.2 7±1.5 7±4.9 9±3.2 6±4.2 dry 12±1.5 11±6.4 11±7.5 16±2.3 7±7.3 10±6.5 10±4.7 9±5.2 15±2.7 8±4.3 of Table – 7 Effect of liquid biofertilizer on morphological parameters and yield of VignaradiataL. (60th day) Morphological Parameters Height of the plant (in cm) Inter nodal length (in cm) 9±4.3 8±4.5 7±2.5 10±4.5 Number of leaves (per plant) Treatments T1 T2 T3 T4 T5 T6 T7 T8 T9 T10 23±2.9 21±3.9 22±4.1 25±2.9 16±8.2 20±3.5 19±5.1 21±2.6 24±8.7 17±1.9 6±1.5 7±2.3 7±1.5 7±5.6 10±1.5 6±4.9 19±2.8 17±2.6 18±2.9 21±5.5 9±9.8 16±2.8 16±2.5 16±4.7 20±8.7 10±1.2 @ IJTSRD | Available Online @ www.ijtsrd.com | Volume – 2 | Issue – 3 | Mar-Apr 2018 Page: 611
International Journal of Trend in Scientific Research and Development (IJTSRD) ISSN: 2456-6470 Leaf weight (mg\plant) Leaf weight (mg\plant) Number pods plant) Number seeds (per plant) Number of root nodules (per plant) Shoot length (in cm) Root length (in cm) Root weight (mg\plant) Root weight (mg\plant) Yield (seed in gram) fresh 14±5.2 14±3.2 14±4.5 15±4.5 11±1.5 13±5.6 12±2.5 14±2.3 15±1.5 11±3.2 dry 13±3.2 12±4.5 13±1.2 13±5.2 10±3.5 11±4.9 11±1.5 12±3.5 13±4.5 10±4.2 of (per 12±1.5 11±4.5 11±6.5 14±2.3 8±2.2 10±1.6 9±4.6 10±5.5 13±2.5 8±3.5 of 16±4.6 16±0.2 16±1.5 19±9.5 12±0.9 14±2.5 13±2.8 15±2.5 17±8.9 12±3.2 19±4.5 18±4.2 18±4.8 20±8.5 16±2.5 17±4.5 17±2.8 17±5.6 19±7.9 16±4.6 11±6.7 11±4.9 10±1.5 11±1.2 9±4.2 11±3.4 13±4.1 12±4.5 7±2.5 9±2.5 8±4.5 10±3.9 8±1.2 10±2.5 9±2.5 10±4.6 12±4.2 12±1.5 7±4.5 9±4.5 fresh 12±4.5 11±4.8 12±2.5 13±2.5 8±3.5 10±3.2 9±1.9 10±4.5 13±0.2 8±4.2 dry 9±6.7 9±1.5 9±4.2 10±2.5 6±4.5 8±4.5 8±2.2 8±5.6 10±0.7 7±2.1 16±4.6 16±0.2 16±1.5 19±9.5 12±0.9 14±2.5 13±2.8 15±2.5 17±8.9 12±3.2 Values are triplicates, mean ± standard deviation product. Azospirillumspbacteria present in liquid (Pindi and Satyanarayana, 2012). Acidic pH always confirms no RESULTS AND DISCUSSION The present study was carried out to isolate and identify the bacterial and fungal species from paddy field soils at Vedharaniyam, Nagappatinam District, Tamilnadu, South India. The effect of different liquid biofertilizer on growth VignaradiataL. were studied. The results shown that viability of bacterium and fungi tend to decline during storage of biofertilizer but did not significantly reduce the effect on growth and production of plant. Generally, fungi and bacteria found in deep layer or slow growing due to unavailability of mineral nutrients and compaction of soil along depth (Dkhar and Mishra, 1992). Morphometric Parameters Height of the Plant (in cm) and productivity of At 30th day, maximum height of the plant was recorded in T4 (14±2.3) and T9 (13±2.5) the combined inoculations, followed by other treatments, T1 (10±5.1), T3 (9.2±4.5), T2 (9±3.3), T8 (9±2.5), T6 (9±2.2), T7 (8±3.4), T10 (7±2.2) and T5 (8±2.2). On 45th day, maximum height of the plant was observed in combined inoculation T4 (16±2.4) and T9 (15±2.6) followed by T1 (12±5.1), T3 (11±0.5), T2 (11±2.2), T8 (10±2.1), T6 (9±4.5), T7 (9±3.5), T10 (8±8.2) and T5 (8±2.7). On 60th day, maximum height of the plant was shown by T4 (25±2.9) and T9 (24±8.7) (21±2.6) followed by T1 (23±2.9), T3 (22±4.1), T2 (21±3.9), T8 (21±2.6), T6 (20±3.5), T7 (v), T10 (17±1.9) and T5 (16±8.2) (Plate – VII, Fig - 1 and Table -5 to 7). Physical features of liquid Rhizobiumspwasdull white in colour, No bad smell, No foam formation and pH 6.8 to 7.5 was observed. Colour of the liquid Azospirillumsp may be blue or dull white. Bad odours confirm improper liquid may be broth. Production of yellow gummy colour materials confirms the quality @ IJTSRD | Available Online @ www.ijtsrd.com | Volume – 2 | Issue – 3 | Mar-Apr 2018 Page: 612
International Journal of Trend in Scientific Research and Development (IJTSRD) ISSN: 2456-6470 maximum number of shoot length was recorded in combined inoculation such as T4 (8±1.2) and T9 (3±8.2) followed by T1 (7±3.2), T3 (5±2.8), T2 (6±2.5), T8 (5±0.2), T6 (4±8.5), T7 (4±4.5), T10 () and T5 (3±6.8). At60th day, maximum number of shoot length was recorded in combined inoculation such as, T4 (13±4.1) and T9 (12±4.2) followed by T1 (11±6.7), T3 (9±4.2), T2 (10±1.5), T8 (8±1.2), T6 (8±4.5), T7 (8±1.2), T10 (7±4.5) and T5 (7±2.5) (Table – 5 to 7). Number of Leaves (per plant) At 30th day, maximum number of leaves in the plant was recorded in T4 (9±4.5) and T9 (9±3.2) the combined inoculations, followed by T1 (9±2.1), T3 (9±1.5), T2 (9±0.2), T8 (8±4.5), T6 (8±3.5), T7 (8±1.2), T10 (7±2.3) and T5 (7±1.2). On 45th day, maximum number of leaves in the plant was observed in combined inoculation of T4 (12±2.3) and T9 (11±4.9) followed by T1 (11±2.3), T3 (11±1.5), T2 (10±4.9), T8 (9±5.2), T6 (9±3.5), T7 (10±2.5), T10 (8±2.8) and T5 (8±4.9). On 60th day, maximum leaves in the plant was shown by T4 (21±5.5) and T9 (20±8.7) followed by T1 (19±2.8), T3 (18±2.9), T2 (17±2.6), T8 (16±4.7), T6 (16±2.8), T7 (16±2.5), T10 (10±1.2) and T5 (9±9.8) (Table – 5 to 7). Root Length (in cm) On 30th day, maximum number of root length in the plant was observed in combined inoculation of T4 (7±1.2) and T9 (6±4.5) followed by T1 (5±4.5), T3 (5±4.2), T2 (5±3.5), T8 (5±4.2), T6 (5±3.5), T7 (4±4.5), T10 (4±3.5) and T5 (4±1.5) (Table – 5 to 7). At 45th day, maximum number of root length in the plant was observed in combined inoculation of T4 (8±5.7) and T9 (8±4.5) followed by T1 (6±4.2), T3 (6±1.5), T2 (6±0.8), T8 (5±7.5), T6 (5±6.8), T7 (5±5.5), T10 (4±5.3) and T5 (4±4.3). AtIn 60th day, maximum number of root length in the plant was observed in combined inoculation of T4 (12±4.5) and T9 (12±1.5) followed by T1 (11±4.9 ), T3 (11±3.4), T2 (11±1.2), T8 (10±4.6), T6 (10±3.9), T7 (10±2.5), T10 (9±4.5) and T5 (9±2.5). Number of Flowers (per plant) On 45th day maximum number of flowers in the plant was recorded in T4 (16±2.3) and T9 (15±2.7) followed by other liquid biofertilizer treatments T1 (12±1.5), T3 (11±7.5), T2 (11±6.4), T8 (9±5.2), T6 (10±6.5), T7 (10±4.7), T10 (8±4.3) and T5 (7±7.3) (Table - 6). Number of Root Nodules (per plant) Among the overall treatments on 30th day, maximum number of root nodules were recorded in combined inoculation such as, T4 (7±6.5) and T9 (7±5.7) followed by T1 (6±4.5 ), T3 (5±2.8), T2 (5±2.6), T8 (5±2.6), T6 (5±2.5), T7 (4±2.5), T10 (4±2.2) and T5 (4±1.2). Among the overall treatments on 45th day, maximum number of root nodules were recorded in combined inoculation such as T4 (8±6.7) and T9 (8±5.9) followed by T1 (7±4.7), T3 (7±2.7), T2 (6±8.9), T8 (6±8.8), T6 (6±2.4), T7 (6±0.6), T10 (5±4.2) and T5 (5±1.5). At 60th day, maximum number of root nodules were recorded in combined inoculation such as T4 (20±8.5) and T9 (19±7.9) followed by T1 (19±4. 5), T3 (18±4.8), T2 (18±4.2), T8 (17±5.6), T6 (17±4.5), T7 (17±2.8), T10 (16±4.6) and T5 (16±2.5) (Table – 5 to 7). Internodal Length (in cm) At 30th day, maximum level of inter nodule length was recorded in combined inoculations, i.e., T4 (5±4.2) and T9 (5±2.5) followed by T1 (4±5.1), T3 (4±4.2), T2 (4±3.4), T8 (4±3.2), T6 (4±2.5), T7 (3±9.2), T10 (3±2.3) and T5 (3±2.1). On 45th day, maximum level of inter nodule length was recorded in combined inoculations, T4 (7±4.5) and T9 (6±5.8) followed by T1 (6±4.2), T3 (6±2.9), T2 (5±2.5), T8 (5±8.4), T6 (5±3.7), T7 (4±3.6), T10 (4 ±9.5) and T5 (4±2.9). At 60th day, maximum level of inter nodule length was recorded in combined inoculations, T4 (10±4.5) and T9 (10±1.5) followed by T1 (9±4.3), T3 (7±2.5), T2 (8±4.5), T8 (7±5.6), T6 (7±2.3), T7 (7±1.5), T10 (6±4.9) and T5 (6±1.5) (Fig – 1 and Table – 5 to 7). Shoot Length (in cm) Leaf Fresh Weight (mg\pant) On 30th day, maximum number of shoot length in the plant was observed in combined inoculation of T4 (7±1.4) and T9 (6±5.4) followed by T1 (4±9.5), T3 (5±1.5), T2 (4±9.5), T8 (4±1.5), T6 (3±1.5), T7 (4±4.2), T10 (3±3.8) and T5 (7±2.1). At 45th day, At 30th day, maximum level of leaf fresh weight was recorded in combined inoculations, T4 (8±9.5) and T9 (8±8.2) followed by other treatments, T1 (8±7.5), T3 (8±6.8), T2 (8±5.7), T8 (7±5.9), T6 (7±2.5), T7 (7±1.2), T10 (6±5.2) and T5 (6±2.5). At 45th day, @ IJTSRD | Available Online @ www.ijtsrd.com | Volume – 2 | Issue – 3 | Mar-Apr 2018 Page: 613
International Journal of Trend in Scientific Research and Development (IJTSRD) ISSN: 2456-6470 maximum level of leaf fresh weight was recorded in T4 (12±2.5) and T9 (12±1.2) the combined inoculations, followed by T1 (11±3.9), T3 (11±2.2), T2 (11±1.2), T8 (10±9.2), T6 (9±2.5), T7 (9±1.5), T10 (7±5.5) and T5 (7±1.5). At 60th day, maximum level of leaf fresh weight was observed in combined inoculation of T4 (15±4.5) and T9 (15±1.5) followed by T1 (14±5.2), T3 (14±4.5), T2 (14±3.2), T8 (14±2.3), T6 (13±5.6), T7 (12±2.5), T10 (11±3.2) and T5 (11±1.5) (Table – 5 to 7 and Fig - 3). weight was observed in T4 (9±4.5) and T9 (9±3.2) followed by other treatments T1 (9±1.5), T3 (8±2.6), T2 (8±1.2), T8 (7±4.9), T6 (7±3.2), T7 (7±1.5), T10 (6±4.2) and T5 (6±3.1). At 60th day, maximum level of root dry weight was observed in T4 (10±2.5) and T9 (10±0.7) the combined inoculations, followed by other treatments T1 (9±6.7), T3 (9±4.2), T2 (9±1.5), T8 (8±5.6), T6 (8±4.5), T7 (8±2.2), T10 (7±2.1) and T5 (6±4.5) (Fig – 5 and Table- 1 to 7). Number of Seeds (gm.\plant) Leaf Dry Weight (mg\plant) On 60th day, maximum level of seeds were observed in T4 (19±9.5) and T9 (17±8.9) followed by other treatments T1 (16±4.6), T3 (16±1.5), T2 (16±0.2), T8 (15±2.5), T6 (14±2.5), T7 (13±2.8), T10 (12±3.2) and T5 (12±0.9). At 30th day, maximum level of leaf dry weight was observed in combined inoculation of T4 (6±8.5) and T9 (6±7.2) followed by other treatments T1 (6±6.5), T3 (6±5.5), T2 (6±4.1), T8 (6±2.8), T6 (6±3.2), T7 (6±1.5), T10 (5±4.9) and T5 (5±1.5). On 45th day, maximum level of leaf dry weight was shown by combined inoculation of T4 (9±5.6) and T9 (9±4.9) followed by other treatments, T1 (8±3.8), T3 (8±2.5), T2 (7±4.9), T8 (7±5.6), T6 (6±7.2), T7 (6±2.2), T10 (5±5.9) and T5 (5±2.5). In 60th day maximum level of leaf dry weight was shown by combined inoculation of T4 (13±5.2) and T9 (13±4.5) followed by T1 (13±3.2), T3 (13±1.2), T2 (12±4.5), T8 (12±3.5), T6 (11±4.9), T7 (11±1.5), T10 (10±4.2) and T5 (10±3.5) (Table – 5 to 7 and Fig - 3). Number of Pods (per plant) In 60th day, maximum level of pods were observed in T4 (14±2.3) and T9 (13 ± 2.5) the combined inoculations, followed by other treatments T1 (12±1.5), T3 (11±6.5), T2 (11±4.5), T8 (10±5.5), T6 (10±1.6), T7 (9±4.6), T10 (8±3.5) and T5 (8±2.2). (Plate - IX and Table -7) Yield (seed in gram) In 60th day, maximum level of yield was observed in combined inoculation of treatments such as, T4 (19 ± 9.5) and T9 ( 17 ± 8.9) followed by other treatments T1 (16 ± 4.6 ), T3 (16± 1.5), T2 (16 ± 1.2), T8 (15± 5.8), T6 (15± 2.5), T7 (13± 2.8), T10 (12 ± 3.2) and T5 (12 ± 0.9). Root Fresh Weight (mg\plant) At 30th maximum level of root fresh weight was observed in combined inoculation of T4 (9±9.5) and T9 (9±1.5) followed by T1 (8±8.5), T3 (8±2.3), T2 (7±4.5), T8 (7±1.5), T6 (6±4.9), T7 (6±1.3), T10 (5±4.9) and T5 (5±1.5).On 45th day, maximum level of root fresh weight was shown by combined inoculation of T4 (10±5.6) and T9 (10±4.5) followed by T1 (10±2.5), T3 (9±4.5), T2 (9±2.3), T8 (8±4.5), T6 (8±2.6), T7 (7±4.9), T10 (7±3.1) and T5 (6±4.2). On 60th day, maximum of root fresh weight was recorded in combined inoculation of T4 (10±2.5) and T9 (10±0.7) followed by other treatments T1 (9±6.7), T3 (9±4.2), T2 (9±1.5), T8 (8±5.6), T6 (8±4.5), T7 (8±2.2), T10 (7±2.1) and T5 (6±4.5) (Fig – 5 and Table – 5 to 7). CONCLUSION Bacterial and fungal biofertilizers are presently used on a very small scale as compared to chemical compounds. There has been little investment in the research and development of bacterial and fungal products because these may have poor effect in the field. Future research therefore must develop bacterial and fungal products, which have significant effect in field applications and are stable under storage. REFERENCE Root Dry Weight (mg\plant) 1.Anita chanda, K. and Tanya, C. 2016. Production of liquid biofertilizer and study it’s effectively on plant growth. International Agricutural science and Research, 220(2016). At 30th day, maximum level of root dry weight was observed in T4 (7±4.2) and T9 (7±3.8) followed by other treatments T1 (7±2.5), T3 (7±1.2), T2 (6±5.4), T8 (6±4.1), T6 (6±3.2), T7 (6±2.1), T10 (5±3.5) and T5 (5±2.2). At 45th day, maximum level of root dry Journal 6(3):211- of @ IJTSRD | Available Online @ www.ijtsrd.com | Volume – 2 | Issue – 3 | Mar-Apr 2018 Page: 614
International Journal of Trend in Scientific Research and Development (IJTSRD) ISSN: 2456-6470 2.Ansari, M.F.,Devayani, R., Tipre.andShailesh, R. Dave. Efficiency evalution of commercial liquid biofertilizers for growth of ciceraeritinum. J. Environs. Biol., 4(1): 17-24(2014). 9.Han’s Christain Gram, cellular response of bacteria to the Gram Stain. Journal of Bacteriology, 56(2) : 846-856(2006). 10.Harman, G.E. and Howell, C.R. Trichoderma species – opportunistic. A virulent plant sympionts. Nat. Rev .Microbial., 2: 43 -56(1884). 3.Arcand, M.M. and Schneider, K.D. Plant and microbial-based mechanisms to improve the agronomic effectiveness of phosphate rock: a review. Ann. Acad. Bras. Ciênc. 78: 791- 807(2006). 11.Norris, J.R. and Ribbons, D.W. Methods in Microbiology, Academic press New york. 4: 795 – 799 (1972). 4.Bailey, R.W. and Scott, B.G. Diagnostic Microbiology. 2nd Microorganisms by company(1996). 12.Pindi, P.K. and Satyanarayana, S.D.Liquid Microbial Consortium- A Potential Tool for Sustainable Soil BiofertilBiopesticides., 3:4– 6(2010). ed. St. Louis: C.V Health. Journal of 5.Beijerinck,Bergey's Bacteriology. 8th ed., Baltimore: Williams and Wilkins Co., in press(1889). Manual of Systematic 13.Ronald Atlas, M.Serial Dilution technique. Fundamentals and Ecology, 4: 694(1998). Application ofMicrobial 6.Dkhar, M.S. and Mishra, R.R.. Microbial population of three different agricultural field soils of Meghalaya, Geobios new reports. 11: 66- 72(1992). 14.Vinale, F., Sivasithamparam, K., Ghisalberti, E.L., Marra, R., Woo, S.L. and Lorito, M. Major secondary metabolites commercial Trichoermastrains active against different phytopathogens. Letters in Applied Microbiology, 43:143-148(2006). produced by two 7.Dwivedi, R.S.. Soil fungi of grasslands of Varanasi I.Edaphic factors and fungi.Proc. Nat.Acad. Sci., 35:255-274(1966). 8.Ellis, Commonwealth Mycological survey, UK(1971). 15.Warcup, J.H. The soil plate methods for fungi from soil. Nature, 1 : 117-118(1950). M. B.. Dematiaceoushyphomycetes. Institute: kew, @ IJTSRD | Available Online @ www.ijtsrd.com | Volume – 2 | Issue – 3 | Mar-Apr 2018 Page: 615