Download
1 / 7
70 likes | 73 Views
This research aims to test and analyze the influences of workload pressure X1 , role ambiguity X2 towards job satisfaction Y . This research is conducted at PT Pegadaian Sharia Unit Kanwil XII Surabaya with 42 appraiser samples and to be analyzed by Partial Least Square PLS data processing technique. Data collection methods applied in this research are literature study and field survey. And, Likert is the applied scale. Based on the analysis and discussion performed, it is concluded that Workload Pressure affects Job Satisfaction significantly of 0.407. The second hypothesis, that Role Ambiguity affects Job Satisfaction significantly of 0.208. So, it can be concluded that Workload Pressure and Role Ambiguity variables affect Job Satisfaction at PT. Pegadaian Unit Syariah Kanwil XII Surabaya. Asnia Purwaningsih | Anis Eliyana | Ahmad Rizki Sridadi "Understanding Workload Pressure, Role Ambiguity and Job Satisfaction" Published in International Journal of Trend in Scientific Research and Development (ijtsrd), ISSN: 2456-6470, Volume-3 | Issue-4 , June 2019, URL: https://www.ijtsrd.com/papers/ijtsrd23913.pdf Paper URL: https://www.ijtsrd.com/economics/other/23913/understanding-workload-pressure-role-ambiguity-and-job-satisfaction/asnia-purwaningsih<br>

E N D
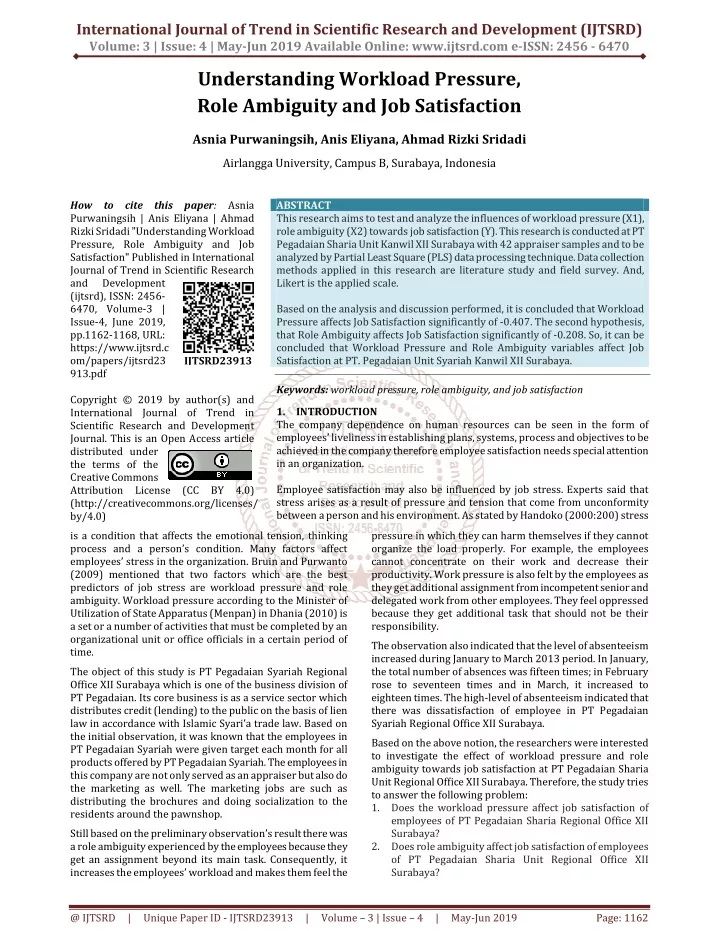
International Journal of Trend in Scientific Research and Development (IJTSRD) Volume: 3 | Issue: 4 | May-Jun 2019 Available Online: www.ijtsrd.com e-ISSN: 2456 - 6470 Understanding Workload Pressure, Role Ambiguity and Job Satisfaction Asnia Purwaningsih, Anis Eliyana, Ahmad Rizki Sridadi Airlangga University, Campus B, Surabaya, Indonesia How to cite this paper: Asnia Purwaningsih | Anis Eliyana | Ahmad Rizki Sridadi "Understanding Workload Pressure, Role Ambiguity and Job Satisfaction" Published in International Journal of Trend in Scientific Research and Development (ijtsrd), ISSN: 2456- 6470, Volume-3 | Issue-4, June 2019, pp.1162-1168, URL: https://www.ijtsrd.c om/papers/ijtsrd23 913.pdf Copyright © 2019 by author(s) and International Journal of Trend in Scientific Research and Development Journal. This is an Open Access article distributed under the terms of the Creative Commons Attribution License (CC BY 4.0) (http://creativecommons.org/licenses/ by/4.0) is a condition that affects the emotional tension, thinking process and a person’s condition. Many factors affect employees’ stress in the organization. Bruin and Purwanto (2009) mentioned that two factors which are the best predictors of job stress are workload pressure and role ambiguity. Workload pressure according to the Minister of Utilization of State Apparatus (Menpan) in Dhania (2010) is a set or a number of activities that must be completed by an organizational unit or office officials in a certain period of time. The object of this study is PT Pegadaian Syariah Regional Office XII Surabaya which is one of the business division of PT Pegadaian. Its core business is as a service sector which distributes credit (lending) to the public on the basis of lien law in accordance with Islamic Syari’a trade law. Based on the initial observation, it was known that the employees in PT Pegadaian Syariah were given target each month for all products offered by PT Pegadaian Syariah. The employees in this company are not only served as an appraiser but also do the marketing as well. The marketing jobs are such as distributing the brochures and doing socialization to the residents around the pawnshop. Still based on the preliminary observation’s result there was a role ambiguity experienced by the employees because they get an assignment beyond its main task. Consequently, it increases the employees’ workload and makes them feel the ABSTRACT This research aims to test and analyze the influences of workload pressure (X1), role ambiguity (X2) towards job satisfaction (Y). This research is conducted at PT Pegadaian Sharia Unit Kanwil XII Surabaya with 42 appraiser samples and to be analyzed by Partial Least Square (PLS) data processing technique. Data collection methods applied in this research are literature study and field survey. And, Likert is the applied scale. Based on the analysis and discussion performed, it is concluded that Workload Pressure affects Job Satisfaction significantly of -0.407. The second hypothesis, that Role Ambiguity affects Job Satisfaction significantly of -0.208. So, it can be concluded that Workload Pressure and Role Ambiguity variables affect Job Satisfaction at PT. Pegadaian Unit Syariah Kanwil XII Surabaya. Keywords: workload pressure, role ambiguity, and job satisfaction 1.INTRODUCTION The company dependence on human resources can be seen in the form of employees’ liveliness in establishing plans, systems, process and objectives to be achieved in the company therefore employee satisfaction needs special attention in an organization. Employee satisfaction may also be influenced by job stress. Experts said that stress arises as a result of pressure and tension that come from unconformity between a person and his environment. As stated by Handoko (2000:200) stress pressure in which they can harm themselves if they cannot organize the load properly. For example, the employees cannot concentrate on their work and decrease their productivity. Work pressure is also felt by the employees as they get additional assignment from incompetent senior and delegated work from other employees. They feel oppressed because they get additional task that should not be their responsibility. The observation also indicated that the level of absenteeism increased during January to March 2013 period. In January, the total number of absences was fifteen times; in February rose to seventeen times and in March, it increased to eighteen times. The high-level of absenteeism indicated that there was dissatisfaction of employee in PT Pegadaian Syariah Regional Office XII Surabaya. Based on the above notion, the researchers were interested to investigate the effect of workload pressure and role ambiguity towards job satisfaction at PT Pegadaian Sharia Unit Regional Office XII Surabaya. Therefore, the study tries to answer the following problem: 1.Does the workload pressure affect job satisfaction of employees of PT Pegadaian Sharia Regional Office XII Surabaya? 2.Does role ambiguity affect job satisfaction of employees of PT Pegadaian Sharia Unit Regional Office XII Surabaya? IJTSRD23913 @ IJTSRD | Unique Paper ID - IJTSRD23913 | Volume – 3 | Issue – 4 | May-Jun 2019 Page: 1162
International Journal of Trend in Scientific Research and Development (IJTSRD) @ www.ijtsrd.com eISSN: 2456-6470 2.Literature Review Workload Pressure Workload pressure according to the Minister of Utilization of State Apparatus (Menpan) in Dhania (2010) is a set or a number of activities that must be completed by an organizational unit or office officials in a certain period of time. Workload measurement is defined as a technique to obtain information about efficiency and effectiveness of an organizational unit or officials that performed systematically using job analysis technique, workload analysis technique or other management technique. Furthermore, it was stated that the workload measurement is one of the management techniques to get official function information through analytical research and assessment process. Official function information is intended to use as a foundation to enhance the apparatus in its institutional, procedures and human resources. Role Ambiguity Role ambiguity which is also one of the factors that influences job stress can be regarded as vagueness of the role performed by an employee either one role or multiple role in the company. It maybe because the company is less able to communicate the role or duties that belong to the employees’ responsibility (Ahsan: 2009). Baron in Koustelious, et al. (2004) stated that the role ambiguity is a situation where employees feel uncertain about the needs of their work and about the convinient way the work is done. Ursprung in Ahsan (2009) stated that role ambiguity occurs when an individual does not have information about role requirements that should be fulfilled and about available evaluative procedure to ensure that the roles within an organization has worked properly. Job Satisfaction Job satisfaction is the level of individual satisfaction upon his position in the organization compared to other coworkers. Job satisfaction is an attitude held by the individual in his work. Such attitudes arise as a result of each individual to their work (Robbins: 2001). According to Veitzhal (2004: 475) job satisfaction is basically something individual. Based on Veitzhal’s opinion above, it can be concluded that a person can measure how satisfied himself to something that he has done individually. Therefore, it is the employee himself who will understand about his satisfaction measurement and it is based on the ability that he owned to do his job in the organization/company. Furthermore, one study even revealed that job satisfaction factor significantly influences employees’ commitment to their organization (Eliyana, et al., 2012) 3.Thinking Framework The present study tested whether workload pressures and role ambiguity each has influence on job satisfaction. Based on the theoretical basis that has been mentioned above, the hypotheses of present study were formulated as below: Hypothesis Development Based on research objectives that have been discussed previously, the hypotheses in this study are as follows: 1.Workload has significant negative influence on the job satisfaction of the employees at PT Pegadaian Sharia Unit Regional Office XII Surabaya. 2.Work ambiguity has significant negative influence on the job satisfaction of the employees at PT Pegadaian Sharia Unit Regional Office XII Surabaya. 4.Research Methods Operational Definition Workload Pressure (X1) Workload pressures are a number of activities that must be completed by the employee of PT Pegadaian Sharia Unit in Surabaya in a certain period. The workload pressure indicators in this study are as the following: 1.Mental Demand: the employees’ difficulty in perception to the task given by the company. 2.Physical Demand: the amount of physical activity required by the employees of PT Pegadaian Sharia Unit in Surabaya to complete the task assigned by the company. 3.Temporal Demand: the time given by the company to the employees to complete the task assigned. 4.Performance: how much success of the employee of PT Pegadaian Sharia Unit who believes that they can accomplish the task given by the company. 5.Effort: How hard the mental physical work needed to complete the work. 6.Frustration level: the degree of safety and comfort that is perceived while carrying the work. Role Ambiguity (X2) Role ambigity is a situation where employees experienced the vagueness of the role in the organization so that the result of the performance is not optimal. The indicator of role ambiguity in this study are explained as follows: 1.The belief in the authority. The belief that the employees have towards the authority of PT Pegadaian Sharia Unit in Surabaya 2.The clarity of employment purpose. The clarity of the purpose that is achieved from work that the employees of PT Pegadaian Sharia Unit have done. 3.The ability in time management. The employees’ ability in time management when doing work given by the company. 4.The clarity of Roles and Responsibilities. The clarity of duties and reponsibilities given to the employees. 5.The clarity of expectation to the employees. The clarity regarding the company’s expectation to employees on given tasks. 6.Enough explanation. Adequate explanation about the things that should be done by the company within the company. Job satisfaction (Y) Job satisfaction is the employees’ general attitude regarding the result obtained by the employees of PT Pegadaian Sharia Unit in Surabaya. Satisfaction measurements use five supporting factors showed by Smith et al. (1969) as follows: @ IJTSRD | Unique Paper ID - IJTSRD23913 | Volume – 3 | Issue – 4 | May-Jun 2019 Page: 1163
International Journal of Trend in Scientific Research and Development (IJTSRD) @ www.ijtsrd.com eISSN: 2456-6470 a.Salary It is the employees’ general attitude regarding the amount of salary received by the employees of PT Pegadaian Sharia Unit in Surabaya. b.Promotion It is the employee’s general attitude regarding opportunities to develop their career in PT Pegadaian Sharia Unit in Surabaya. c.Job Content It is the company’s general attitude regarding the characteristic of the tasks and the jobs given by the company to the employees. d.Relationship with colleagues. It is the employees of PT Pegadaian Sharia Unit general attitude on to what extent the colleagues support the work both technically and socially. e.Relationship with supervisor It is the general attitude regarding supervisor’s ability to provide technical support for the employees of PT Pegadaian Sharia Unit in Surabaya. Variables measurements To measure the indicators in variables X and Y, it used Likert scale. Likert scale was used to measure attitudes, opinions, and perceptions of person or group about events or social phenomenon. Strongly Agree (SS) = 5 Agree (S) = 4 Neutral (N) = 3 Disagree (TS) = 2 Strongly Disagree (STS) = 1 Sampling Techniques The populations in this study were all the employees of PT Pegadaian Sharia Unit in Surabaya. There were 42 people. Sample according to Sugiyono (2003:73) is part of number and characteristics possessed by population. Sampling technique that was used was non probability sampling method with saturated sampling technique. This sampling technique was used when all member of population used as sample (Sugiyono, 2003:73). In this study, samples were taken from all population of PT Pegadaian Sharia Unit in Surabaya so that the number of samples in this study are 42 people. 5.Data Collection Procedures In this study, data collection techniques that were used are as follows: 1.Literature Study Literature study is a study done by studying the company’s records and supporting literature, and also relating the researches as references in finding the solution from the problems faced by the writer in writing this research. 2.Field Survey Field survey is a research carried out directly to the research object using methods as follows: a.Questionnaires It is a techniques used in data collection by spreading questionnaires containing list of questions about things related to the research objectives to the respondent to obtain direct information. b.Interview It is a technique used in data collection by directly interviewing the relevant parties or respondents for more in-depth informations about the things needed in this research. c.Documentation It is a technique used in data collection by citing the quantitative data from comapny’s archives (documents) which become the subject of the research. Analysis Techniques Analysis techniques of this study are based on data obtained from company’s internal sources and questionnaires results that have been distributed. Then, they are processed using statistical methods through some tests as follows: Validity test Validity test is done to determine the extent of the accuracy and percision of measuring instruments in carrying out its measuring functions. Validity test is done by comparing the r count value with the r table value. If the r count ≤ r table, it can be said that the isntruments used as measuring tools are valid and vice versa. Product moment correlation (r) is used to determine a quantity that expressed the strong part of variable to another variable. Reliability Test Reliability test is intended to determine reliability or consistency of the intruments used (questionnaires). To determine the realiability of the questionnaire, it used internal realiability measurement approach to calculate the value of Cronbach alpha. If greater than 0.06 then it is reliable. Partial Least Square (PLS) The analysis technique used in this study is Partial Least Square (PLS), Ghozali (2008: 22). The path analysis model of all latent variables in PLS consists of two sets of relationship describes as follows: 1.Inner model describes the relationship between latent variables based on a substantive theory. Model equation: Z1 = g x + € Z2 = g X + β z1 + € Z3 = g β X + 2Y + 1Z1 + β € Where g shows the coefficient exogenous to endogenous variables and € shows error (failure rate). 2.Outer model defines how each indicator block associated with latent variables. The processing of Partial Least Square (PLS) is done in three stages: 1.The first stage is to test measurement model by measuring convergent validity and construct reliability from each indicator and to decide whether it is a part of construct or research variables. The interpretation of validity and constructs reliability is from loading factor value. It is valid if construct value is more than 0.5 and it is reliable if the loading factor value greater or equal to 0.7. 2.The second step is to measure the discriminant validity from measurement model with reflexive indicators assessed by cross loading measurement with the construct. If the construct correlation with the measurement items is greater than any other construct size then it shows that the latent constructs predict its own indicator measurement better than other indicators. @ IJTSRD | Unique Paper ID - IJTSRD23913 | Volume – 3 | Issue – 4 | May-Jun 2019 Page: 1164
International Journal of Trend in Scientific Research and Development (IJTSRD) @ www.ijtsrd.com eISSN: 2456-6470 3.The third stage is to test structural models. This stage aims to determine whether there is influence between variables. The test is carried out using t-test. The study’s hypothesis is accepted as true if the t value > t-table or if the significance value greater than 0.05. 7.Result Validity test aims to determine the extent to which the questionnaire is able to measure the desired variables, because the variables in social science tend to be abstract. There are three approaches that can be used to measure the validity, namely content validity, criterion-related validity and construct validity. The instrument item can be determined valid or not by comparing the r value to r table. If r table ≤ r count it can be said that the instrument that is used as a measurement tool is valid and vice versa. R table or a sample of 42 people is 0.202. Table 1Validity Testing Result Workload Pressure Variable (X1) Item Statement r count r table Information 1 0,648 2 0,593 3 0484 4 0,751 5 0,628 6 0,673 Source: Appendix 4 From table 1 above, it can be seen that the values obtained for the six statement items of workload pressure variable has significant level (r count > r table) so that it can be concluded that the entire statement items of workload pressure variable are valid. Validity test result for role ambiguity can be seen as follows: Table 2Validity Testing Result Role Ambiguity Variable (X2) Item Statement r count r table Information 1 0,637 2 0,694 3 0,732 4 0,791 5 0,623 6 0,476 Source: Appendix 4 From the table 2 above, it can be seen that the values obtained for the six statement items of role ambiguity variable have significant value (r count > r table) therefore it can be concluded that the entire statements items of role ambiguity variable are valid. Table 3Validity Testing Result Job Satisfaction Variable Item Statement r count r table Information 1 0,680 2 0,788 3 0,819 4 0,720 5 0,669 Source: Appendix 4 From the table 3 above, it can be seen that the values obtained for the four statement items of Job Satisfaction variable have significant value ( r count > r table ) therefore it can be concluded that the entire statement items of Job Satisfaction variable are valid. Reliability test result Reliability test can be understood through basic idea of that concept, which is consistency. The researcher can evaluate the research instruments based on different perspectives and techniques even though it has the same symptom. The measurement using a numerical index called the coefficient. Cronbach alpha is used for reliability test. An instrument is considered reliable if it has Cronbach alpha above 0.6 (Ghozali, 2001: 133). Here is the result of reliability test as presented in the table below: Table 4Reliability Test Result Cronbach Alpha Count Workload Pressure(X1) Role Ambiguity(X2) Job Satisfaction(Y2) Source: Appendix 4 Ghozali (2001: 41) stated that reliability was measured using Cronbach alpha coefficient value. The questionnaires are said reliable since it has Cronbach alpha coefficient value greater than 0.60. Based on the result of reliability test in table 4, it can be seen that the Cronbach alpha coefficient value of each variables has greater value than 0.60 (value required). It shows that the overall statement items has been reliable. Construct Validity Test To find out whether the used indicator is part of the construct or research variables is by testing the measurement model. It is done by measuring the convergent validity of each indicator. Validity and reliability construct are interpreted from loading factor value. The indicator considered valid if it has construct value more than 0.5. The following is the result of mesurement model test by measuring the convergent validity. Table 5 Convergent Validity Test Result X1,1 <- Workload Pressure (X1) X1,2 <- Workload Pressure (X1) X1,3 <- Workload Pressure (X1) X1,4 <- Workload Pressure (X1) X1,5 <- Workload Pressure (X1) X1,6 <- Workload Pressure (X1) X2,1 <- Role Ambiguity (X2) X2,2 <- Role Ambiguity (X2) X2,3 <- Role Ambiguity (X2) X2,4 <- Role Ambiguity (X2) X2,5 <- Role Ambiguity (X2) X2,6 <- Role Ambiguity (X2) Y1 <- Job Satisfaction (Y1) Y2 <- Job Satisfaction (Y1) Y3 <- Job Satisfaction (Y1) Y4 <- Job Satisfaction (Y1) Y5 <- Job Satisfaction (Y1) Source: Appendix 4 Required Value Item Statement Information 0,845 0,60 Reliable 0,862 0,60 Reliable Valid Valid Valid Valid Valid Valid 0,891 0,60 Reliable 0,202 Valid Valid Valid Valid Valid Valid 0,202 Original Sample (O) 0,8051 0,7060 0,6085 0,8275 0,7446 0,7972 0,6833 0,7365 0,7812 0,8632 0,7859 0,7173 0,8226 0,8848 0,8887 0,8082 0,7629 Valid Valid Valid Valid Valid 0,202 @ IJTSRD | Unique Paper ID - IJTSRD23913 | Volume – 3 | Issue – 4 | May-Jun 2019 Page: 1165
International Journal of Trend in Scientific Research and Development (IJTSRD) @ www.ijtsrd.com eISSN: 2456-6470 Based on the table 5 above, it can be seen that the original value of the sample, in overall, has value more than 0.5. Therefore, it can be said that the used indicators are part of the construct or research variables. Construct Reliability Test To determine the used construct reliability is by testing construct reliability. It is done by measuring construct reliability from each indicator. Construct reliability is interpreted from loading factor value. The indicators are considered reliable if they have loading factor value more than 0.7. The following is the result of construct reliability testing. Table 6Construct Reliability Test Result Job Satisfaction (Y) Role Ambiguity (X2) Workload Pressure (X1) Source: Appendix 4 From the table 6 above, it can be seen that the overall composite reliability value that is obtained is more than 0.7. Therefore, it can be said that the used indicators were reliable. Cross Loading Test The discriminant validity of the measurement model with reflexive indicators are assessed by cross loading measurements with the construct. If the construct correlation with the measurement items is greater than any other construct size then it shows that the latent constructs predict that its own indicator measurement is better than other indicators. The following is the result of cross loading test. Table 7Cross Loading Test Result X1,1 -0.5278 0.3946 X1,2 -0.2400 0.4180 X1,3 -0.2877 0.1794 X1,4 -0.3217 0.4017 X1,5 -0.3434 0.3590 X1,6 -0.4221 0.3216 X2,1 -0.1617 0.6833 X2,2 -0.1770 0.7365 X2,3 -0.1660 0.7812 X2,4 -0.3956 0.8632 X2,5 -0.3270 0.7859 X2,6 -0.3763 0.7173 Y1 0.8226 -0.3076 Y2 0.8848 -0.2591 Y3 0.8887 -0.4360 Y4 0.8082 -0.2968 Y5 0.7629 -0.3649 Source: Appendix 4 Based on the table 7 above, it can be seen that the construct correlation with greater measurement items than any other construct size shows that latent constructs predict that its own indicator size is better than other indicators. Structured Model test Test on structural model is done by looking at R-Square value that is obtained from goodness test – fit model. Inner model examination can be seen from R- Square value on equation between latent variables. Table 8 R-Square calculation result Job Satisfaction (Y) Role Ambiguity (X2) Workload Pressure (X1) Source: Appendix 4 Value Q2 / (R2) = 1 - (1-0) (1-.287) = 0.713. It can be interpreted that the model is good enough. It is able to explain the phenomenon of Job Satisfaction of 71.3 %. While the rest (28.7 %) is explained by other variables besides workload pressure and role ambiguity that have not been included into the model and error. It means that Job Satisfaction is influenced by workload pressure and role ambiguity by 71.3 %, while 28.7% is influenced by variables other than workload pressure and role ambiguity. Furthermore, structural model testing that aims to find out whether there is influence between variables can be seen from its path coefficient. If it is more than 0.05 then it can be concluded that it has significant effect. Composite Reliability 0,9197 0,8929 0,8854 Job Satisfaction (Y) Role Ambiguity (X2) Workload Pressure (X1) 0.8051 0.7060 0.6085 0.8275 0.7446 0.7972 0.2016 0.2559 0.4790 0.3772 0.3790 0.3695 -0.5258 -0.4899 -0.3572 -0.3710 -0.3154 R Square 0,287 0 0 @ IJTSRD | Unique Paper ID - IJTSRD23913 | Volume – 3 | Issue – 4 | May-Jun 2019 Page: 1166
International Journal of Trend in Scientific Research and Development (IJTSRD) @ www.ijtsrd.com eISSN: 2456-6470 Table 9 Structured Model Test Result Original Sample (O) (M) Sample Mean Standard Deviation (STDEV) Standard Error (STERR) T Statistic Role Ambiguity (X2) -> Job Satisfaction (Y) -0,208 -0,1378 0,1808 0,1808 2,339 Workload Pressure (X1) -> Job Satisfaction (Y) -0,407 -0,2386 0,2448 0,2448 5,765 Source: Appendix 4 Based on the table 9, it can be determined: 1.Workload pressure variable has significant effect on job satisfaction. It can be seen from the original sample value of -0.407 which is greater than 0.05. Therefore, it can be said that workload pressure has significant influence on job satisfaction. 2.Role ambiguity variable has significant effect on job satisfaction. It can be seen from the original sample value of -0.208 which is greater than 0.05. Therefore, it can be said that role ambiguity variable has significant effect on job satisfaction. From the whole test that has been carried out, then the data processing result is obtained by using Partial Least Square technique as follows (Figure 1): According to Ambar (2006) workload is the number of tasks and responsibilities that have to be done by the organization or its units in the units of time and certain amount of labor (man – hours). In the definition above, workload scope is more focused on a unit in the organization in which it includes a series of activities undertaken by a group of people in a certain time. However, things which need to be underlined are: even though the workload is owned individually but the analysis is emphasized on its unit or organizational unit since workload is owned by the employees in it. The workload finally becomes each person responsibility in accordance with their duties in a certain time ratio. Workload pressure needs to be analyzed since it is related to employees’ productivity. Workload analysis is a process to determine a number of hours that is used or needed by employee to complete a work in a certain time. In other words, the workload analysis aims to determine the number of personnel and the right amount of workload that can be delegated to a person or officer (Faustino, 2004). Russel & Copper in Widodo (2010) explained that the factors that influence job satisfaction is work pressure, job involvement and work family conflict. The influence of Role Ambiguity towards Employee Job Satisfaction at PT Pegadaian Sharia Unit Regional Office XII Surabaya The result shows that the Role Ambiguity variable significantly affect job satisfaction on employees of PT Pegadaian Sharia Unit Regional Office XII Surabaya. It is based on the Structured Model test result with role ambiguity original sample value towards job satisfaction was at -0.208 where the value was greater than 0.05. It means that the role ambiguity significantly influence job satisfaction. The result of this study shows that the more the person experienced role ambiguity in the organization such as, vagueness in duties and responsibilities or vagueness in company’s operational standards performance result became not optimal, the more the person feels unsatisfied with his job. Based on the empirical data, the highest respondents’ answer for the role ambiguity item is that the respondents feel confused with tasks and responsibilities given by the company, the answer is valued 4.40 ( strongly agree). This is in accordance with the situation experienced by the estimator in which he has the duties based on the Standard Operation Procedure but he also given tasks as a product marketing of PT Pegadaian Sharia Unit. Those additional duties include the socialization and open table once a week in the public places and offices. 8.Discussion The influence of workload pressure to employees’ job satisfaction at PT Pegadaian Sharia Unit Regional Office XII Surabaya The result showed that the workload pressure variable affects significantly to the job satisfaction on employees of PT Pegadaian Sharia Unit Regional Office XII Surabaya. It is based on the result of structured model test with workload pressure original sample value on job satisfaction is at -0.407 where the value is greater than 0.05. It means that the workload pressure significantly influences the job satisfaction. Based on empirical data, the average value of estimator response on workload pressure (X1) is at 3.8. Moreover, it has the highest response from the respondents in the statement item which states that the respondent perceived that their job requires a lot of energy to complete. The item has average value of 3.93 (agree). In the job satisfaction variable, the average value of response is 4.20. The statements given by some of the respondents state that they are satisfied with their salary and the opportunity from the company. It has the highest score at 4.26 (agree). in which their @ IJTSRD | Unique Paper ID - IJTSRD23913 | Volume – 3 | Issue – 4 | May-Jun 2019 Page: 1167
International Journal of Trend in Scientific Research and Development (IJTSRD) @ www.ijtsrd.com eISSN: 2456-6470 [4]Glissmeyer. Michael. 2007. Role Conflict, Role Ambiguity, and Intention to Quit the Organization: The Case of Law Enforcement Officers. Journal Furthermore, in regard with job satisfaction variable, the research shows that the average respondents response give the highest response on the statement about satisfaction on salary and promotion opportunity given by company which is at 4.26 (strongly agree). Spreitzer and Martanti (2005) stated that the role ambiguity is a condition where a person experiences vagueness of role in the organization so that his performances is not optimal. Role ambiguity occurs when people are not sure of others expectations on him. According to the role theory, each position in the formal organization structure needs to have clear rules about each member responsibility in order to facilitate the management to provide direction and guidance as expected. By those reagulations, the employees are able to improve their job satsifaction. Sawyer in Martanti (2005) explained that if an employee does not know the extent of their authority they will be hesitate to take action. It reflected that they didn’t have the ability to make steps and decision in their job. Other than that they will also be into doubt whether they can make changes or cannot affect the outcome of his work. 9.Conclusion Based on the analysis and discussion that has been carried out, this study can be concluded as follows: 1.The first hypothesis which states that workload pressure has negative significant effect towards job satisfaction on employees of PT Pegadaian Sharia Unit in Surabaya is proven true. 2.The second hypothesis which states that role ambiguity has negative significant effect towards job satisfaction on employees of PT Pegadaian Sharia Unit in Surabaya is proven true. References [1]Ahsan. Nilufar. 2009. A Study of Job Stress on Job Satisfaction among University Staff in Malaysia: Empirical Study. European Journal of Social Sciences. Malaysia. [5]Hadiabsar, Jochan, 2011. Pengaruh Leader-Member Exchange (LMX) dan Beban Kerja Terhadap Moral Kerja. Jurnal Gunadarma. Jakarta [6]Handoko, Hani. 2001. Manajemen Personalia dan Sumber Daya Manusia. Edisi 2. BPFE:Yogyakarta. [7]Hasibuan, H. M. 2009. Manajemen Sumber Daya Manusia. Edisi Revisi .Bumi Aksara. Yakarta [8]Hasibuan, S.P. Malayu, 1994. Manajemen Sumber Daya Manusia, Dasar dan Kunci Keberhasilan, CV. Haji Masagung, Jakarta. [9]Khan, Verda. 2011. Impact of Organization Culture on the Job Satisfaction of the Employees (Banking Sector of Pakistan). European Journal of Economics. Pakistan. [10]Manuaba. 2000. Ergonomi Kesehatan dan Keselamatan Kerja dalam Wygnyosoebroto & Wiranto, S.E. ”Eds. Proceeing Seminar Nasional Ergonomo. Surabaya : PT Guna Widya. [11]Martanti, Wahyu Dewi. 2005. Analisis Pengaru Locus Of Control, Role Ambiguity Da Kepemimpinan Terhadap Pemberdayaan Karyawan Komitmen Organisasional. Unversitas Dipenogoro Semarang Untuk Skripsi Meningkatkan Diterbitkan. [12]Robbins, S.P. 2001. Perilaku Organisasi. Salemba Empat. Jakarta [13]Tunjungsari, Peni. 2011. Pengaruh Stress Kerja Terhadap Kepuasan Kerja Karyawan Pada Kantor Pusat PT Pos Indonesia (Persero) Bandung. Jurnal Vol 1 No 1 Maret 2011. Bandung. [14]Ummi, Ummamah. 2012. Pengaruh Tingkat Pendidikan, Masa Bekerja dan Beban Kerja terhadap Tingkat Stres Kerja Perawat di Rumah Sakit Jiwa Pemerintah Aceh. Skripsi Diterbitkan. Universitas Sumatera Utara Medan. [15]Veitzhal Rivai, 2007, Manajemen sumber Daya Manusia Perusahaan dari Teori ke Praktek, PT. Raja Grafindo Persada, Jakarta. [2]Ambar Tegus S dan Rosidah. 2006. Manajemen Sumber Daya Manusia, Graha Ilmu, Yogyakarta. [3]Faustino, Cordoso Games. 2004. Manajemen Sumber Daya Manusia. Edisi 2. Penerbit Andi Jakarta. [16]Widodo. 2010 Model pengembangan kepuasan kerja dengan kepuasan keluarga : Universitas Islam Sultan Agung. Jurnal Bisnis dan Ekonomi. @ IJTSRD | Unique Paper ID - IJTSRD23913 | Volume – 3 | Issue – 4 | May-Jun 2019 Page: 1168