Download
1 / 5
50 likes | 56 Views
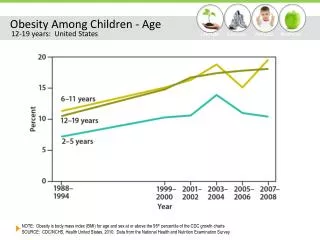
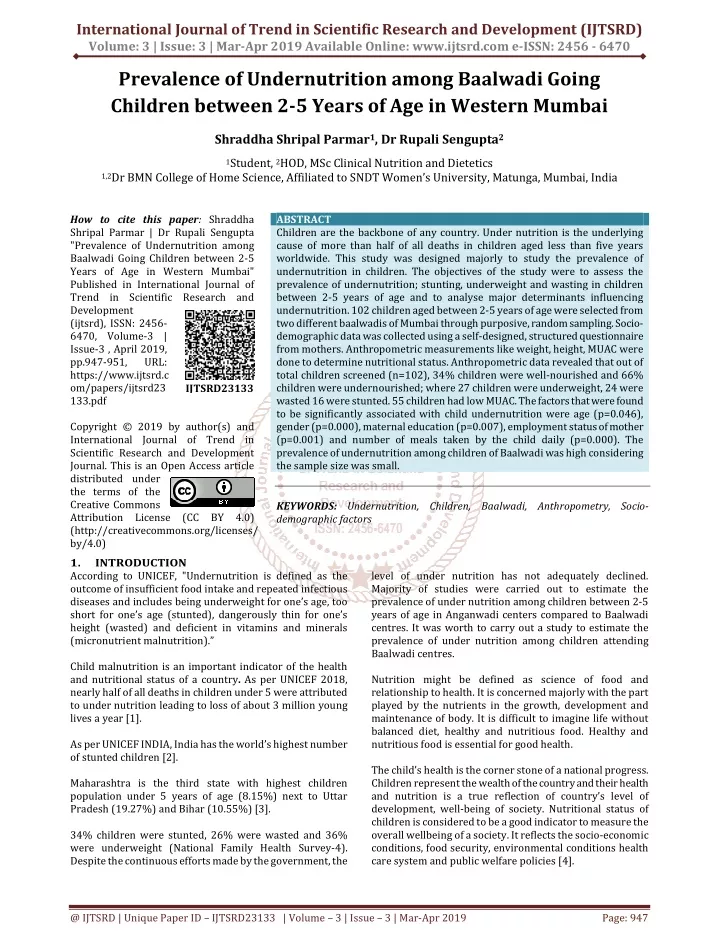
Children are the backbone of any country. Under nutrition is the underlying cause of more than half of all deaths in children aged less than five years worldwide. This study was designed majorly to study the prevalence of undernutrition in children. The objectives of the study were to assess the prevalence of undernutrition stunting, underweight and wasting in children between 2 5 years of age and to analyse major determinants influencing undernutrition. 102 children aged between 2 5 years of age were selected from two different baalwadis of Mumbai through purposive, random sampling. Socio demographic data was collected using a self designed, structured questionnaire from mothers. Anthropometric measurements like weight, height, MUAC were done to determine nutritional status. Anthropometric data revealed that out of total children screened n=102 , 34 children were well nourished and 66 children were undernourished where 27 children were underweight, 24 were wasted 16 were stunted. 55 children had low MUAC. The factors that were found to be significantly associated with child undernutrition were age p=0.046 , gender p=0.000 , maternal education p=0.007 , employment status of mother p=0.001 and number of meals taken by the child daily p=0.000 . The prevalence of undernutrition among children of Baalwadi was high considering the sample size was small. Shraddha Shripal Parmar | Dr Rupali Sengupta "Prevalence of Undernutrition among Baalwadi Going Children between 2-5 Years of Age in Western Mumbai" Published in International Journal of Trend in Scientific Research and Development (ijtsrd), ISSN: 2456-6470, Volume-3 | Issue-3 , April 2019, URL: https://www.ijtsrd.com/papers/ijtsrd23133.pdf Paper URL: https://www.ijtsrd.com/home-science/child-care-and-development/23133/prevalence-of-undernutrition-among-baalwadi-going-children-between-2-5-years-of-age-in-western-mumbai/shraddha-shripal-parmar<br>

E N D
International Journal of Trend in Scientific Research and Development (IJTSRD) Volume: 3 | Issue: 3 | Mar-Apr 2019 Available Online: www.ijtsrd.com e-ISSN: 2456 - 6470 Prevalence of Undernutrition among Baalwadi Going Children between 2-5 Years of Age in Western Mumbai Shraddha Shripal Parmar1, Dr Rupali Sengupta2 1Student, 2HOD, MSc Clinical Nutrition and Dietetics 1,2Dr BMN College of Home Science, Affiliated to SNDT Women’s University,Matunga, Mumbai, India How to cite this paper: Shraddha Shripal Parmar | Dr Rupali Sengupta "Prevalence of Undernutrition among Baalwadi Going Children between 2-5 Years of Age in Western Mumbai" Published in International Journal of Trend in Scientific Research and Development (ijtsrd), ISSN: 2456- 6470, Volume-3 | Issue-3 , April 2019, pp.947-951, URL: https://www.ijtsrd.c om/papers/ijtsrd23 133.pdf Copyright © 2019 by author(s) and International Journal of Trend in Scientific Research and Development Journal. This is an Open Access article distributed under the terms of the Creative Commons Attribution License (CC BY 4.0) (http://creativecommons.org/licenses/ by/4.0) 1. INTRODUCTION According to UNICEF, "Undernutrition is defined as the outcome of insufficient food intake and repeated infectious diseases and includes being underweight for one’s age, too short for one’s age (stunted), dangerously thin for one’s height (wasted) and deficient in vitamins and minerals (micronutrient malnutrition).” Child malnutrition is an important indicator of the health and nutritional status of a country. As per UNICEF 2018, nearly half of all deaths in children under 5 were attributed to under nutrition leading to loss of about 3 million young lives a year [1]. As per UNICEF INDIA, India has the world’s highest number of stunted children [2]. Maharashtra is the third state with highest children population under 5 years of age (8.15%) next to Uttar Pradesh (19.27%) and Bihar (10.55%) [3]. 34% children were stunted, 26% were wasted and 36% were underweight (National Family Health Survey-4). Despite the continuous efforts made by the government, the ABSTRACT Children are the backbone of any country. Under nutrition is the underlying cause of more than half of all deaths in children aged less than five years worldwide. This study was designed majorly to study the prevalence of undernutrition in children. The objectives of the study were to assess the prevalence of undernutrition; stunting, underweight and wasting in children between 2-5 years of age and to analyse major determinants influencing undernutrition. 102 children aged between 2-5 years of age were selected from two different baalwadis of Mumbai through purposive, random sampling. Socio- demographic data was collected using a self-designed, structured questionnaire from mothers. Anthropometric measurements like weight, height, MUAC were done to determine nutritional status. Anthropometric data revealed that out of total children screened (n=102), 34% children were well-nourished and 66% children were undernourished; where 27 children were underweight, 24 were wasted 16 were stunted. 55 children had low MUAC. The factors that were found to be significantly associated with child undernutrition were age (p=0.046), gender (p=0.000), maternal education (p=0.007), employment status of mother (p=0.001) and number of meals taken by the child daily (p=0.000). The prevalence of undernutrition among children of Baalwadi was high considering the sample size was small. KEYWORDS: Undernutrition, Children, Baalwadi, Anthropometry, Socio- demographic factors IJTSRD23133 level of under nutrition has not adequately declined. Majority of studies were carried out to estimate the prevalence of under nutrition among children between 2-5 years of age in Anganwadi centers compared to Baalwadi centres. It was worth to carry out a study to estimate the prevalence of under nutrition among children attending Baalwadi centres. Nutrition might be defined as science of food and relationship to health. It is concerned majorly with the part played by the nutrients in the growth, development and maintenance of body. It is difficult to imagine life without balanced diet, healthy and nutritious food. Healthy and nutritious food is essential for good health. The child’s health is the corner stone of a national progress. Children represent the wealth of the country and their health and nutrition is a true reflection of country’s level of development, well-being of society. Nutritional status of children is considered to be a good indicator to measure the overall wellbeing of a society. It reflects the socio-economic conditions, food security, environmental conditions health care system and public welfare policies [4]. @ IJTSRD | Unique Paper ID – IJTSRD23133 | Volume – 3 | Issue – 3 | Mar-Apr 2019 Page: 947
International Journal of Trend in Scientific Research and Development (IJTSRD) @ www.ijtsrd.com eISSN: 2456-6470 There is emotional bonding between the child and mother, most valuable thing for the child is mother’s time, love, care and support. Child will be dependent on mother for food and will notice the food habits of the family. Children who are well fed during the first two years of life were more likely to stay healthy for the rest of their childhood. Proper nutrition leads to better overall health of an individual, low risk of infections due to good immune system, enhances learning ability of children, healthy body weight, increase self- esteem; looking and feeling better, being energetic and above all strong bones and muscles [5]. Well-nourished children performed better in school, grew into healthy adults and in turn gave children a better start in life [6]. Good Nutrition is a fundamental pillar of human life, health and development across the entire life span. The most vulnerable group to malnutrition and its adverse effects is children below five years of age, who constitute a special risk group in any population. There was strong evidence that malnutrition was associated with impaired growth, poor school performance, delayed mental development and reduced intellectual capacity [7]. The nutritional requirement was disproportionately higher for body weight than older children and adults [8]. Male children were more likely to be malnourished than their female counterparts [9]. The risk of malnutrition increases with age of a child. Children in the youngest age group 0-11 months had significantly lower risk of being stunted, underweight and wasted than children in the older age groups [10]. Children whose mother had no education or had primary education were found significantly stunted and underweight than children whose mothers had secondary or higher level education [11]. Wasting and underweight were also more common among the children of non-working mothers [12]. For practical purposes, anthropometry was the most widely used tool and it had more advantages compared to other indicators. Anthropometry is the most useful method to assess the nutritional status of individuals at the population level. It is a convenient method in terms of being non- invasive, portable, inexpensive and universally applicable and readily available to assess the size, proportion and composition of the human body [13, 14]. Anthropometric measurements are the most common tool that is used to assess the nutritional status of a population and to monitor growth in children. The anthropometric indices commonly used are weight-for-height, height-for-age and weight-for-age expressed as percentiles or z-scores representing the overall nutritional status of a child [15]. For population-based assessment—including nutritional surveillance and surveys, WHO recommended Z-score which is widely recognized as the best system for presentation and analysis of anthropometric data because of its advantages compared to the other methods [16]. MUAC is easy to measure and is relatively independent of age and gender. Because of its simplicity and low cost of measuring, MUAC is used for rapid screening of SAM among 6 to 59 months of age in community [17]. Government of India in recommendations adopted MUAC < 11.5 cm as one of the diagnostic criteria for operationalizing the community- and facility-based management of SAM in the country [18]. 2. OBJECTIVES BROAD OBJECTIVES ?To estimate the prevalence of undernutrition in children aged between 2-5 years through anthropometric measurements SPECIFIC OBJECTIVES ?To assess the prevalence of stunting, underweight and wasting of under five children ?To find association between socio-demographic factors and undernutrition in children 3. METHODOLOGY Study Design A community based study was conducted to assess the prevalence of under nutrition and associated factors among children between 2-5 years of age. Study Area and Period The study was conducted in Mumbai city, Maharashtra, India. Mumbai urban, being one of the largest metropolises in the world, has a heterogeneous population with diverse cultural, religious and economic backgrounds. Due to its diverse economic background; the city provides an ideal setting to study the prevalence of under nutrition in children. 2 baalwadis were selected from Mumbai city. The study was conducted from August to December 2018. Target group selection, Sample Size and Sampling technique 102 children aged between 2-5 years of age were selected by random, purposive sampling. Inclusion and Exclusion criteria: Inclusion criteria: Children aged between 2-5 years of age who live in Mumbai, Parents who were willing to participate, Gender: Boy and Girl Exclusion criteria: Children aged <2 years and >5 years of age, Parents who were not available at the time of data collection, Child with any physical disability Study Variables: Dependent variable: Nutritional status of children below five years Independent variable: Gender, Age, Number of meals consumed per day by children, Employment status and Education of mother. METHODS Data Collection and research tools A.Survey Data were collected using a survey. The data-collection instrument was a self-developed questionnaire including closed questions and consisting of two sections. The first section included questions with regard to the child (gender, age, number of meals taken per 24 hours). The second line with international @ IJTSRD | Unique Paper ID - IJTSRD23133 | Volume – 3 | Issue – 3 | Mar-Apr 2019 Page: 948
International Journal of Trend in Scientific Research and Development (IJTSRD) @ www.ijtsrd.com eISSN: 2456-6470 section included questions with regard to the parent’s characteristics (the parent’s education level, the parent’s employment status) B.Anthropometric Analysis Heights, weights and MUAC were assessed from a total of 102 children. In this study anthropometry was used to measure nutritional status of the children. Three indices were used in the evaluation of nutritional status (weight for age, weight for height and height for age) and MUAC. z scores were generated for weight for age, height for age, weight for height and MUAC using WHO ANTHRO software. Weight and height measurements were taken thrice to ensure accuracy and an average of these measures were taken. Weight: Weights were measured using a very sensitive Electronic Digital Body Weight Weighing Scale and recorded 4.RESULTS Table 1: Distribution of samples according to their nutritional status Attributes Normal Undernourished to the nearest 10 gm. The reading was taken after making sure that the child was not in any contact with other object. Height: Heights were taken from children with a non-elastic measuring tape and were recorded to the nearest 0.1 cm. MUAC: Non-elastic measuring tape was used to measure mid-upper arm circumference (MUAC) and data was also recorded to the nearest 0.1 cm. DATA ANALYSIS Descriptive and statistical analysis was done using IBM SPSS version 20.0and anthropometric analysis was done using Z- scores obtained from WHO ANTHRO software. Chi-square test was used to measure association between independent variable and under nutrition. Frequency 35 67 16 9 2 27 12 4 0 16 15 7 2 24 Total Total Mild (-1 to -2 SD) Moderate (-2 to -3 SD) Severe (Beyond -3 SD) Total Mild Moderate Severe Total Mild Moderate Severe Total Weight for age (Underweight) Height for age (Stunting) Weight for Height (Wasting) According to Table 1, out of total children, 67 children were underweight and 35 were normal. Underweight (n=27) was the most common under nutrition problem among under five year old children. There was also prevalence of wasting (n=24) and stunting (n=16) under five year old children considering the fact that the sample of children was small in number for the study. According to nutritional status of height for age (Stunted), 12 children were mildly stunted, followed by 4 children who were moderately stunted. No child was severely stunted. According to nutritional status of weight for age (Underweight), 16 children were mildly underweight, followed by 9 children who were moderately underweight and 2 children were severely underweight. According to nutritional status of weight for height (Wasting), 15 children were mildly wasted, followed by 7 children who were moderately wasted and 2 children were severely stunted. 55 children had low MUAC. Table 2: Distribution of children according to MUAC: Undernutrition in terms of MUAC Z-score Frequency Mild Moderate Severe Total Out of 102 children, 55 children were undernourished. 46 children were suffering from mild level of under nutrition followed by 9 children with moderate under nutritionand 4 with severe under nutrition. Table 3: Factors associated with under nutrition among children between 2-5 years of age 46 9 0 55 Chi-square value p- Variables Underweight Wasted Stunted Normal value 2-3 3-4 4-5 Male Female 5 7 15 18 9 3 19 5 6 6 12 16 8 2 16 2 2 2 12 9 7 0 13 3 1 17 17 5 30 1 18 20 Age (Years) 12.784 0.04 Gender 23.502 0.000 No formal education Till matriculation Beyond matriculation Education level of mother 17.723 0.007 @ IJTSRD | Unique Paper ID - IJTSRD23133 | Volume – 3 | Issue – 3 | Mar-Apr 2019 Page: 949
International Journal of Trend in Scientific Research and Development (IJTSRD) @ www.ijtsrd.com eISSN: 2456-6470 One Two Three Four Five Employed Unemployed - 3 12 12 0 16 11 - 2 12 10 0 13 9 - 1 13 22 0 10 6 - 0 0 3 32 5 32 No. of meals taken by child per day 98.986 0.000 Employment status of mother According to table 3, it was studied that all the factors (Age, Gender, Education level of mother, No. of meals taken by the child, Employment status of mother) showed a high significant association with under nutrition statistically. 5.DISCUSSION Out of 102 children, 35 were normal and 67 were undernourished. 26% of children were underweight (26%) followed by wasting (24%) and stunting (16%) respectively. The prevalence of under nutrition was high considering the fact that the sample size was small. 22% of children were wasted and these findings were higher than the national figures of wasting at 21%. 43 children were suffering from mild under nutrition; 20 children were suffering from moderate under nutrition; 4 children were suffering from severe under nutrition. When age was compared with under nutrition in children, highest prevalence of underweight was observed in the age group 4-5 years. Higher rate of under nutrition in the age group of 4-5 years might be linked to inappropriate food supplementation. The proportion of under five children with under nutrition showed statistically high significant association with their age (p=0.046) at p=0.05 using chi- square test. This finding thus lends credence to the study by Nguyen et al 2008 who found out that risk of malnutrition increases with age of a child. When gender was compared with under nutrition in children, it was observed that boys were found to be more underweight as compared to the girls. For wasting and stunting, boys were equally more wasted and stunted respectively as compared to their female counterparts. Undernourishment was observed more in boys as they might get influenced more to environmental stress. Boys are rarely at home and tend to be active around in the neighborhood. A highly significant relationship statistically was noted (p=0.000) at p=0.05 between sex of child and under nutrition using chi square test. The findings correspond to the study by Babatunde et al 2011 who found out that male children were more likely to be malnourished than their female counterparts. When mother’s education level was compared with under nutrition in children, the data revealed the higher prevalence of stunting, underweight, wasting was observed among children whose mothers had no education or with primary education. The declining pattern of all three indicators was shown with improvement in the mother’s education. Underweight was most commonly seen among children of mothers with education up to matriculation. Mother’s education level might affect child’s nutrition through her choices and health seeking skills related to nutrition, hygiene, preventive care disease treatment, tend to use healthcare facilities better to interact effectively with health care providers, to keep their living environment clean. A highly significant relationship statistically was noted (p=0.007) at p=0.05 between maternal level of education up to matriculation and under nutrition using chi square test. The findings of the study co-related with the study by Nure 20.827 0.001 et al 2011 who revealed that children whose mother had no education or had primary education were found significantly stunted and underweight than children whose mothers had secondary or higher level education. When under nutrition was compared with no. of meals taken by the child per day, it was found that most of the children were taking meals less than 5 times per day. Highest prevalence of under nutrition was observed when children took meals three times per day because the recommended feeding meals were not met. No under nutrition was observed in children when they took meals 5 times per day. A highly significant relationship was associated statistically (p=0.000) at p=0.05 between inadequate no. of meals taken by the child per day and under nutrition when chi square test was done. When maternal employment status was compared with under nutrition in children, it was found out that most children had unemployed mothers. Highest prevalence of under nutrition was observed in children with unemployed mothers. According to table 4.48, when statistics was done, a chi-square test showed high significant relationship (p=0.001) at p=0.05 between maternal employment status and under nutrition. The findings of the study correspond to the study by Somme felt et al 1994 who found out that wasting and underweight were more common among the children of non-working mothers. 6.CONCLUSION Nutrition is important particularly for a school child. Children who are undernourished tend to perform more poorly on tests of cognition than those who eat food. The present study was conducted in two baalwadis for collecting data regarding child’s socio-demographic profile, anthropometric measurements and to find association between socio-demographic factors and under nutrition. In the present study, it was found out that under nutrition was highly prevalent among children (n=67) and was one of the major challenges affecting under-five children in baalwadis of Mumbai. It was revealed that out of 102 children, the most common form of under nutrition included underweight (n=27) followed by wasting (n=24) and stunting (n=16) respectively. This study also showed that, a good nutritional status of children was directly related to their mother’s education level, mother’s employment status, child’s gender, child’s age and no. of meals taken by the child per day. Children aged 2- 4 years were less likely to be underweight than those aged 4- 5 years. @ IJTSRD | Unique Paper ID - IJTSRD23133 | Volume – 3 | Issue – 3 | Mar-Apr 2019 Page: 950
International Journal of Trend in Scientific Research and Development (IJTSRD) @ www.ijtsrd.com eISSN: 2456-6470 [9]Babatunde, R. O. (2011). Prevalence and determinants of malnutrition among under-five children of farming households in Kwara state, Nigeria. Journal of agricultural science, 67-69 Under nutrition was more common in boys as compared to girls; a similar trend was noticed in mothers with education up to matriculation and employed mothers. Under nutrition was also found to be common among children taking meals 3 times per day. Only 35 children were found to be well nourished, 43 children suffered from mild under nutrition, 20 were moderately undernourished and only 4 subjects were found to be severely under nourished. 7.ACKNOWLEDGMENT We are very grateful to baalwadis for providing the necessary permission to carry out the study and to the parents for their active, enthusiastic participation and involvement in the study. Funding: No funding sources Conflict of interest: None declared Ethical approval: The study was approved by jury members of the Institutional Ethical Committee which was established in 2012 8.REFERENCES [1]UNICEF data.unicef.org/topic/nutrition/malnutrition [10]Nguyen, N. H., and Kam. S. (2008).Nutritional status and the characteristics related to malnutrition in children under-five years of age in Nghean, Vietnam. Journal of preventive medicine and public health, 41(4), 232-240. [11]Nure, A. S., Nuruzzaman, H., Abdul, G. (2011). Mulnutrition of under five children: Evidence from Bangladesh. Asian Journal of medical sciences 2,113- 119. [12]Sommerfelt, A., and Stewart, K. (1994). Children’s nutritional status. DHS Comparative Studies. Calverton, Maryland, USA: Macro International Inc. [13]WHO,www.who.int/nutgrowthdb/about/introduction [14]De Onis M, Garza C, Victoria CG, Bhan MK and Norum KR. 2004. WHO multicentre growth reference study MGRS: Rationale, planning and implementation. Food and Nutrition Bulletin, 25 (supplementary 1): S1 – S89. 2018, [15]Gorstein J, Sullivan K, Yip R, de Onís M, Trowbridge F, Fajans P, Clugston G., et al., Issues in the assessment of nutritional status using anthropometry. Bull World Health Organ. 1994; 72(2): 273-283 [2]UNICEF INDIA, unicef.in/whatwedo/10/stunting [3]www.childlineindia.org.in/child-in-india [4]Swaminathan (2004) Advanced Text Book of Food and Nutrition.2nd Edition; Bangalore: Bangalore Printing and Co limited: 2004: p 230, 540 [16]WHO,www.who.int/childgrowth/publications/physica l_status [5]Brown, J. 2013. Nutrition Now 7th edition. Page 431-34 [17]Myatt M, Khara T, Collins S. A review of methods to detect cases of severely malnourished children in the community for their admission into community-based therapeutic care programs. Food Nutr Bull 2006;27(3 Suppl): S7–23. [6]frac.org/benefits-school-breakfast [7]Pelletier D, Frongillo EA Jr, Habicht JP. Epidemiologic evidence for a potentiating effect of malnutrition on child mortality. Am J Public Health 1993; 83: 1130–33. [18]Government of India. Operational Guidelines on Facility Based Management of Children with Severe Acute Malnutrition. New Delhi: Ministry of Health and Family Welfare Government of India, 2011. [8]Mendez MA, Adair LS. Severity and timing of stunting in the first two years of life affect performance on cognitive tests in late childhood. J Nutr 1999; 129: 1555–62. @ IJTSRD | Unique Paper ID - IJTSRD23133 | Volume – 3 | Issue – 3 | Mar-Apr 2019 Page: 951