Download
1 / 5
50 likes | 192 Views
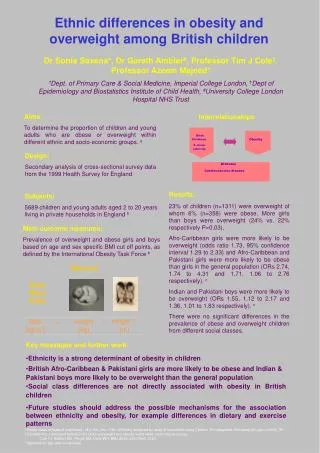
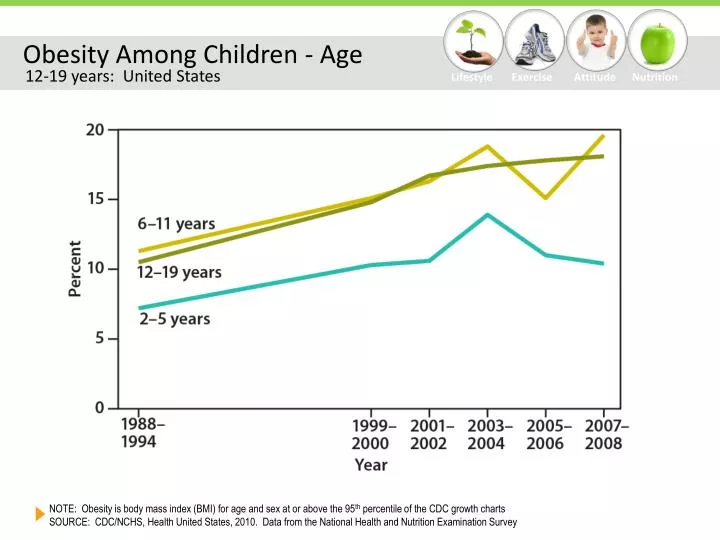
Obesity Among Children - Age. 12-19 years: United States. NOTE: Obesity is body mass index (BMI) for age and sex at or above the 95 th percentile of the CDC growth charts SOURCE: CDC/NCHS, Health United States, 2010. Data from the National Health and Nutrition Examination Survey.

E N D
Obesity Among Children - Age 12-19 years: United States NOTE: Obesity is body mass index (BMI) for age and sex at or above the 95th percentile of the CDC growth charts SOURCE: CDC/NCHS, Health United States, 2010. Data from the National Health and Nutrition Examination Survey
Obesity Among Children - Sex 12-19 years: United States SOURCE: Data from the National Health and Nutrition Examination Survey: 2009-2010
Obesity Among Children – Sex/Age 12-19 years: United States SOURCE: Data from the National Health and Nutrition Examination Survey: 2009-2010
Prevalence of Obesity - Boys 12-19 years, by race/ethnicity: United States NOTE: Obesity is body mass index (BMI) for age and sex at or above the 95th percentile of the CDC growth charts SOURCE: CDC/NCHS, National Health and Nutrition Examination Survey (NHANES) III 1988-1994 and NHANES 2007-2008
Prevalence of Obesity - Girls 12-19 years, by race/ethnicity: United States NOTE: Obesity is body mass index (BMI) for age and sex at or above the 95th percentile of the CDC growth charts SOURCE: CDC/NCHS, National Health and Nutrition Examination Survey (NHANES) III 1988-1994 and NHANES 2007-2008