Download
1 / 5
50 likes | 52 Views
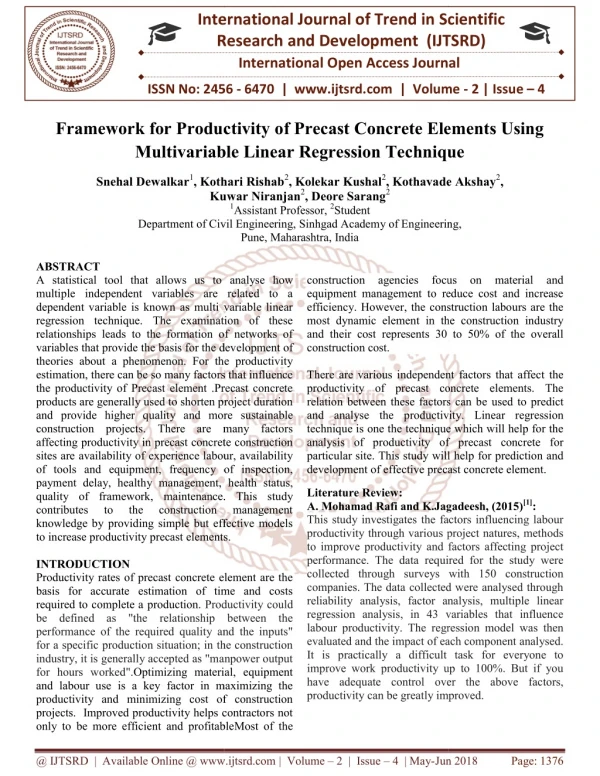
The linear regression is a linear approach for modeling the relationship between a scalar dependent variable y and one or more explanatory variables denoted X. A linear regression analysis method is used to improve the performance of the instruments using light scattering method. The data measured by these instruments have to be converted to actual PM10 concentrations using some factors. These findings propose that the instruments using light scattering method can be used to measure and control the PM10 concentrations of the underground subway stations. In this study, the reliability of the instrument for PM measurement using light scattering method was improved with the help of a linear regression analysis technique to continuously measure the PM10 concentrations in the subway stations. In addition, the linear regression analysis technique was also applied to calibrate a radon counter with the help of an expensive radon measuring apparatus. Chungyong Kim | Gyu-Sik Kim "Calibration of Environmental Sensor Data Using a Linear Regression Technique" Published in International Journal of Trend in Scientific Research and Development (ijtsrd), ISSN: 2456-6470, Volume-2 | Issue-1 , December 2017, URL: https://www.ijtsrd.com/papers/ijtsrd7060.pdf Paper URL: http://www.ijtsrd.com/engineering/electrical-engineering/7060/calibration-of-environmental-sensor-data-using-a-linear-regression-technique/chungyong-kim<br>

E N D
International Research Research and Development (IJTSRD) International Open Access Journal International Open Access Journal International Journal of Trend in Scientific Scientific (IJTSRD) ISSN No: 2456 - 6470 | www.ijtsrd.com | Volume Calibration of Environmental Sensor Data Calibration of Environmental Sensor Data ISSN No: 2456 | www.ijtsrd.com | Volume - 2 | Issue – 1 Calibration of Environmental Sensor Data using a Linear Regression Technique sing a Linear Regression Technique Chungyong Kim Gyu-Sik Kim* Sik Kim* Department of Electrical and Computer Eng., University of Seoul, Seoul, Korea Department of Electrical and Computer Eng., University of Seoul, Seoul, Korea Department of Electrical and Compu University of Seoul, *Corresponding Author: gskim318@uos.ac.kr *Corresponding Author: gskim318@uos.ac.kr Department of Electrical and Computer Eng., University of Seoul, Seoul, Korea ABSTRACT The linear regression is a linear approach for modeling the relationship between a scalar dependent variable y and one or more explanatory variables denoted X. A linear regression analysis method is used to improve the performance of the instruments using light scattering method. The data measured by these instruments have to be converted to actual PM concentrations using some factors. These findings propose that the instruments using light scattering method can be used to measure and control the PM concentrations of the underground subway stations. this study, the reliability of the instrument for measurement using light scattering method was improved with the help of a linear regression analysis technique to continuously measure the PM concentrations in the subway stations. In addition, linear regression analysis technique was also applied to calibrate a radon counter with the help of an expensive radon measuring apparatus. linear regression is a linear approach for modeling the relationship between a scalar dependent variable y and one or more explanatory variables A linear regression analysis method is used to improve the performance of the instruments t scattering method. The data measured by these instruments have to be converted to actual PM10 concentrations using some factors. These findings propose that the instruments using light scattering method can be used to measure and control the PM10 concentrations of the underground subway stations. In the reliability of the instrument for PM using light scattering method was improved with the help of a linear regression analysis technique to continuously measure the PM10 entrations in the subway stations. In addition, the s, these sensors in subway stations suffer from poor quality of data and the unreliability of the sensor due to the highly deteriorated and polluted environment, which may cause the measuring instruments installed for monitoring to malfunction. of the online measurement can determine the failure or success of IAQ monitoring and assessment. Although practitioners agree with this opinion, very little attention has been given to the study of sensors in a A linear regression analysis method is used to improve the performance of the instruments using light scattering method. The data measured by these instruments have to be converted concentrations using some factors. that the instruments using light scattering method can be used to measure and concentrations of the underground Sometimes, these sensors in subway stations suffer from poor quality of data and the unreliability of the sensor due to the highly deteriorated and polluted environment, which may cause the measuring instruments installed for monitoring to malfunction. The quality of the online measurement can determine the failure or success of IAQ monitoring and assessment. Although practitioners agree with this opinion, very little attention has been given to the study of sensors in a realistic manner [6, 7]. A linear regression analysis method is used to improve the performance of the instruments using light scattering method. The data measured by these instruments have to be converted to actual PM10 concentrations using some factors. These findings propose that the instruments using light scattering method can be used to measure and control the PM10 concentrations of the underground subway stations. most most researchers researchers and and was also applied to calibrate a radon counter with the help of an Keywords: PM10, linear regression analysis, subway station, radon counter, radon measuring apparatus I. INTRODUCTION , linear regression analysis, subway radon measuring apparatus the reliability of the instrument for PM using light scattering method was improved with the help of a linear regression analysis technique to continuously measure the PM10 concentrations in the subway stations [8]. In addition, linear regression analysis technique was also applied to calibrate a radon counter with the help of an expensive radon measuring apparatus. In this study, the reliability of the instrument for measurement using light scattering method was improved with the help of a linear regression analysis technique to continuously measure the PM concentrations in the subway stations the linear regression analysis technique applied to calibrate a radon counter with the help o an expensive radon measuring apparatus. II. Linear Regression Analysis Linear Regression Analysis The IAQ (Indoor Air Quality) in the subway stations can be affected by many factors, such as the number of passengers, the outside conditions and the natural ventilation rate [1, 2], etc. The managemen monitoring of IAQ in subway stations has become an important issue of public interest [3 environmental sensors are important for monitoring IAQ in subway systems and they provide the data needed for continuous online implementation. needed for continuous online implementation. in the subway stations can be affected by many factors, such as the number of passengers, the outside conditions and the natural ventilation rate [1, 2], etc. The management and monitoring of IAQ in subway stations has become an important issue of public interest [3-5]. Some environmental sensors are important for monitoring IAQ in subway systems and they provide the data In statistics, linear regression is a linear approach for modeling the relationship between a scalar dependent In statistics, linear regression is a linear approach for modeling the relationship between a scalar dependent variable y and one or more explanatory variables (or variable y and one or more explanatory variables (or @ IJTSRD | Available Online @ www.ijtsrd.com @ IJTSRD | Available Online @ www.ijtsrd.com | Volume – 2 | Issue – 1 | Nov-Dec 2017 Dec 2017 Page: 715
International Journal of Trend in Scientific Research and Development (IJTSRD) ISSN: 2456-6470 independent variables) denoted X. The case of one explanatory variable is called simple linear regression. For more than one explanatory variable, the process is called a multiple linear regression. In linear regression, the relationships are modeled using linear predictor functions whose unknown model parameters are estimated from the data. Such models are called linear models. Most commonly, the conditional mean of y given the value of X is assumed to be an affine function of X; less commonly, the median of the conditional distribution of y given X is expressed as a linear function of X. Like all forms of regression analysis, linear regression focuses on the conditional probability distribution of y given X, rather than on the joint probability distribution of y and X, which is the domain of multivariate analysis. Linear regression was the first type of regression analysis to be studied rigorously, and to be used extensively in practical applications. This is because models which depend linearly on their unknown parameters are easier to fit than models which are non-linearly related to their parameters and because the statistical properties of the resulting estimators are easier to determine. regression analysis method. The error e can be expressed in eq (2) N e y mx b In order to find the unknown variables ˆ m and ˆb which minimize the differentiations are used as N e x y mx b m e y mx b b From eq (3), we can get eq (4). N N N m x b x x y ˆ 2 ˆ (2) ( ( )) i i i 1 error e, the partial ˆ ˆ 2 ( ( )) 0 i i i ˆ i 1 (3) N ˆ ˆ 2 ( ( )) 0 ˆ i i i 1 ˆ 2 i ˆ i i i i 1 i 1 i 1 (4) N N ˆ ˆ m x bN y i i i 1 i 1 Linear regression models are often fitted using the least squares approach, but they may also be fitted in other ways, such as by minimizing the "lack of fit" in some other norm (as with least absolute deviations regression), or by minimizing a penalized version of the least squares loss function as in ridge regression (L2-norm penalty) and lasso (L1-norm penalty). Conversely, the least squares approach can be used to fit models that are not linear models. Thus, although the terms "least squares" and "linear model" are closely linked, they are not synonymous. Eq (5) can be obtained using eq (4). N N N x y m N x N x y i i i i ˆ i 1 i 1 i 1 N N 2 i 2 ( x ) (5) i i 1 i 1 N N 1 N ˆ ˆ b ( y m x ) i i i 1 i 1 III. Data PM2.5 and PM10 refer to particulate matter with particle diameter up to 2.5 microns and 10 microns, respectively, and are among the most dangerous air pollutants. Due to their small size, PM2.5 particles can travel deep into the human lung and cause a variety of health issues; for instance, by triggering asthma attacks or contributing to cardiovascular disease. Linear Regression Analysis Applied To PM Fig. 1 Approximation to a straight line A linear regression straight line is expressed as eq (1). ˆ ˆ y mx b (1) In Fig.1, the data dotted in small circles can be approximated to a straight line using a linear One instrument using beta-ray absorption method (E- BAM) and the other instrument using light scattering method (HCT) were installed and measured at the platform of the Jegi station of Seoul metro line Number 1 for 5 days. The measured data are shown in Fig. 2. Using the linear regression analysis technique @ IJTSRD | Available Online @ www.ijtsrd.com | Volume – 2 | Issue – 1 | Nov-Dec 2017 Page: 716
International Journal of Trend in Scientific Research and Development (IJTSRD) ISSN: 2456-6470 shown in Fig. 3, the measurement data of HCT in Fig. 2 can be corrected as shown in Fig. 4. In Fig. 3, the correlation coefficient R2 was 0.9868. They are very highly correlated. It can also be seen in Fig. 4 that the measurement data of HCT was closely similar as those of E-BAM if they were corrected using a linear regression technique. So, it can be concluded that a linear regression technique would be very helpful for the performance improvement of light scattering instruments such as HCT. Fig. 4 Measurement data of E-BAM and HCT (After correction) IV.Linear Regression Analysis Applied To Radon Data A commercial PIN photodiode can be used to detect radiation, and particularly, alpha particles. It is low cost, has good quantum efficiency, and good energy resolution. It can also work with a low bias voltage. A PIN photodiode is more widely used than a conventional photomultiplier tube (PMT) because it requires less biasing to operate and it is very compact. The Mega 2560 is a microcontroller board based on the Atmega 2560. It has 54 digital input/output pins (of which 15 can be used as Pulse Width Modulation (PWM) outputs), 16 analog inputs, 4 UARTs (hardware serial ports), a 16 MHz crystal oscillator, a USB port, a power jack, an in-circuit serial programming (ICSP) header, and a reset button. It contains everything needed microcontroller; it just needs to be connected to a computer with a USB cable or powered with an AC- to-DC adapter or battery. The Mega 2560 board is compatible with most shields designed for the Uno and the older Duemilanove and Diecimila boards. In our experiments, we used a radon counter assembled from very low-cost consumer electronics. The circuit designs for the power, high voltage generator, LCD, switch, LED, buzzer, microprocessor control unit (MCU), and sensor circuit were made. Using these circuit elements, we developed the PIN photodiode radon-counter printed circuit board (PCB) layout and then assembled the PIN photodiode radon counter shown in Fig. 5. Fig. 2 Measurement data of E-BAM and HCT (Before correction) to support the Fig. 3 Results of linear regression analysis of E- BAM and HCT @ IJTSRD | Available Online @ www.ijtsrd.com | Volume – 2 | Issue – 1 | Nov-Dec 2017 Page: 717
International Journal of Trend in Scientific Research and Development (IJTSRD) ISSN: 2456 International Journal of Trend in Scientific Research and Development (IJTSRD) ISSN: 2456 International Journal of Trend in Scientific Research and Development (IJTSRD) ISSN: 2456-6470 measured radon counts per hour of the implemented diode radon counter could be calibrated as shown in Fig. 8. Fig. 8 shows the linear regression analysis for 12 hours data average. Fig. 9 and Fig. 10 show those for 24, 36 hours data average, measured radon counts per hour of the implemented PIN photodiode radon counter could be calibrated as shown in Fig. 8. Fig. 8 shows the linear regression analysis for 12 hours data average. Fig. 9 and Fig. 10 show those for 24, 36 hours data average, respectively. Fig. 5 Implemented PIN photodiode radon counter Implemented PIN photodiode radon counter The RAD7 is a highly versatile instrument that can form the basis of a measurement system. It may be used in many different modes for different purposes. The RAD7 radon monitor apparatus uses an air pump and a solid state alpha detector which consists of a semiconductor material that converts alpha radiation directly to an electrical signal. It has desiccant (CaSO inlet filters (pore size 1 μm) that block fine dust particles and radon daughters from entering the radon test chamber. The RAD7’s internal sample cell is a 0.7 litter hemisphere, coated on the inside with an electrical conductor. The center of the hemisphere is occupied by a silicon alpha detector. One important benefit of solid state devices is ruggedness. Another advantage is the ability to immediately differentiate radon from thoron by the energy of the alpha particle released. The RAD7 has also the ability to tell the difference between the new radon daughters and the old radon daughters left from previous tests. The equipment is portable and battery operated, and the measurement is fast. Fig. 6 shows the radon measurement system RAD7. The RAD7 is a highly versatile instrument that can basis of a measurement system. It may be used in many different modes for different purposes. The RAD7 radon monitor apparatus uses an air pump and a solid state alpha detector which consists of a semiconductor pha radiation directly to an electrical signal. It has desiccant (CaSO4) tubes and inlet filters (pore size 1 μm) that block fine dust particles and radon daughters from entering the radon test chamber. The RAD7’s internal sample cell is a phere, coated on the inside with an electrical conductor. The center of the hemisphere is occupied by a silicon alpha detector. One important benefit of solid state devices is ruggedness. Another advantage is the ability to immediately differentiate from thoron by the energy of the alpha particle released. The RAD7 has also the ability to tell the difference between the new radon daughters and the old radon daughters left from previous tests. The equipment is portable and battery operated, and the surement is fast. Fig. 6 shows the radon comprehensive comprehensive radon radon Fig. 7: Experimental set-up for radon calibration up for radon calibration Fig. 8 Linear regression analysis for 12 hours data average Fig. 8 Linear regression analysis for 12 hours data average Fig 9: Linear regression analysis for 24 hours data average average Linear regression analysis for 24 hours data Fig. 6 Radon measuring apparatus RAD7 Fig. 6 Radon measuring apparatus RAD7 The methyl methacrylate box was made for radon concentration calibration as shown in Fig. 7. The calibration experiment was done for 72 hours for varied concentration of radon gas. Using RAD7, the varied concentration of radon gas. Using RAD7, the The methyl methacrylate box was made for radon concentration calibration as shown in Fig. 7. The calibration experiment was done for 72 hours for @ IJTSRD | Available Online @ www.ijtsrd.com @ IJTSRD | Available Online @ www.ijtsrd.com | Volume – 2 | Issue – 1 | Nov-Dec 2017 Dec 2017 Page: 718
International Journal of Trend in Scientific Research and Development (IJTSRD) ISSN: 2456-6470 REFERENCES 1.Soon-Bark Kwon, Youngmin Cho, Duckshin Park, Eun-Young Park, "Study on the indoor air quality of seoul metropolitan subway during the rush hour," Indoor Built Environment, vol.17, no.4, pp.361-369, 2008 2.Soon-Bark Kwon, Duckshin Park, Youngmin Cho, Eun-Young Park, "Measurement of natural ventilation rate in seoul metropolitan subway cabin," Indoor Built Environment, vol.19, no.3, pp.366-374, 2010 3.Harrison R.M., A.R. Deacon, and M.R. Jones, "Sources and processes affecting concentration of PM2.5 and PM10 particulate matter in Birmingham (U.K.)," Atmospheric Environment, vol.31, no.24, pp.4103-4117, 1997 4.Aarnio, P., et al., "The concentrations and composition of exposure to fine particle (PM2.5) in the Helsinki subway system," Atmospheric Environment, vol.39, pp.5059-5066, 2005 5.Branis, M., "The contribution of ambient sources to particulate pollution in spaces and trains of the Prague underground Atmospheric Environment, vol.40, pp.348-356, 2006 Fig. 10 Linear regression analysis for 36 hours data average V. A linear regression analysis method is used to improve the performance of the instruments using light scattering method. The data measured by these instruments have to be converted to actual PM10 concentrations using some factors. These findings propose that the instruments using light scattering method can be used to measure and control the PM10 concentrations of the underground subway stations. Concluding Remarks transport system," In this study, the reliability of the instrument for PM measurement using light scattering method was improved with the help of a linear regression analysis technique to continuously measure the PM10 concentrations in the subway stations. In addition, the linear regression analysis technique was also applied to calibrate a radon counter with the help of an expensive radon measuring apparatus. ACKNOWLEDGMENT This work was also supported by the National Research Foundation of Korea (NRF) grant funded by the Korea government (MSIP) (No. 2016011249). 6.C. Rosen, L. Rieger, U. Jeppsson, and P. A. Vanrolleghem, "Adding realism to simulated sensors and actuators," Water Science & Technology, vol.57, no.3, pp.337-344, 2008 7.Chang Kyoo Yoo, Kris Villez, Stijn W.H. Van Hulle, and Peter A. Vanrolleghem, "Enhanced process and monitoring for wastewater treatment systems," Environmetrics, vol.19, no.6, pp.602- 617, Sept., 2008 8.Seber, G.A.F., Linear Regression Analysis, John Wiley & Sons, New York, pp.80-130, 1997 9.S. Folea, M. Hulea, G.Mois, V. Cosma, “Wi-Fi portable solution measurements,” Rom. Journ. Phys., vol.58, pp.S126-s139, 2013 10.Ryan H. Griffin and N. Garry Tarr, “Optical image sensors and their application in radon detection,” in Proceedings of SPIE, vol.8915, pp.8915C-1~7, Oct., 2013 11.Gyu-Sik Kim, Tae-Gue Oh and Jae-Hak Kim, “Implementation of a PIN photodiode radon counter,” Global Journal of Engineering Science and Researches, vol. 3, no.1, pp.58-63, Jan., 2016 for distributed radon @ IJTSRD | Available Online @ www.ijtsrd.com | Volume – 2 | Issue – 1 | Nov-Dec 2017 Page: 719