Download
1 / 5
50 likes | 59 Views
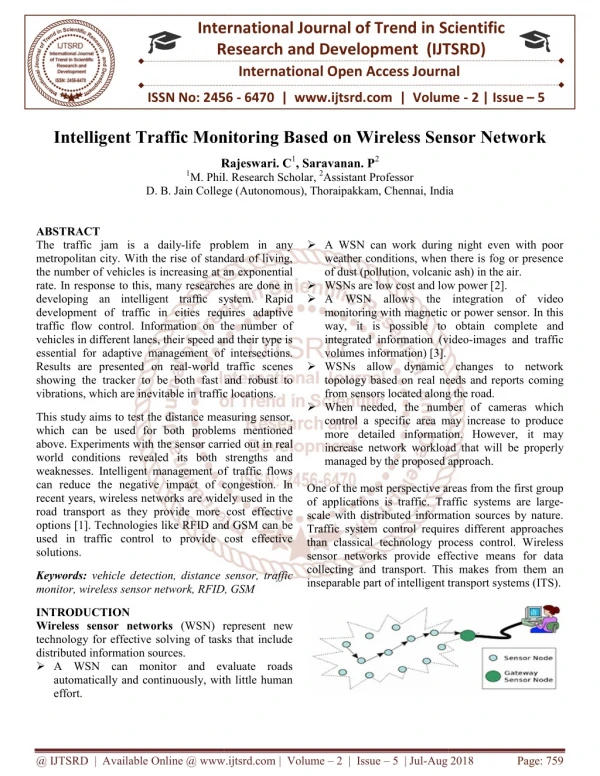
Sensor networks are currently an active research area mainly due to the potential of their applications. In this paper we discussed about the use of Wireless Sensor Networks WSN for air pollution monitoring. Wireless Sensor Networks is an excellent technology that can sense, measure, and gather information from the real world and, based on some local decision process transmit the sensed data to the user. These networks allow the physical environment to be measured at high resolutions, and greatly increase the quality and quantity of real world data and information for applications like pollution monitoring. Inhaling pollutants for a long time causes damages in human health and the air quality is a major concern in modern cities due to significant impacts of air pollution on global environment, and worldwide economy. To avoid such adverse imbalances in the nature, an air pollution monitoring system is utmost important. Usually the three air pollutants gases including carbon monoxide, carbon dioxide and sulphur dioxide in air because these gases decides the degree of pollution level. Pradeep G Pillai | Saravanan. P "A Study on Air Pollution Monitoring System using Wireless Sensor Network" Published in International Journal of Trend in Scientific Research and Development (ijtsrd), ISSN: 2456-6470, Volume-2 | Issue-2 , February 2018, URL: https://www.ijtsrd.com/papers/ijtsrd8374.pdf Paper URL: http://www.ijtsrd.com/computer-science/computer-network/8374/a-study-on-air-pollution-monitoring-system-using-wireless-sensor-network/pradeep-g-pillai<br>

E N D
International Research Research and Development (IJTSRD) International Open Access Journal n Air Pollution Monitoring System sing Wireless Sensor Network International Journal of Trend in Scientific Scientific (IJTSRD) International Open Access Journal ISSN No: 2456 ISSN No: 2456 - 6470 | www.ijtsrd.com | Volume 6470 | www.ijtsrd.com | Volume - 2 | Issue – 2 A Study on Air Pollution Monitoring System using Wireless Sensor Network n Air Pollution Monitoring System Pradeep G Pillai Pradeep G Pillai M.Phil. Research Scholar, D.B.Jain College (Autonomous), Thoraipakkam, Saravanan. Saravanan. P M.Phil. Research Scholar, D.B.Jain College (Autonomous), Thoraipakkam, Chennai, India Assistant Professor, D.B.Jain College (Autonomous), Thoraipakkam, Assistant Professor, D.B.Jain College (Autonomous), Thoraipakkam, Chennai, India Chennai, India ABSTRACT Sensor networks are currently an active research area mainly due to the potential of their applications. In this paper we discussed about the use of Wireless Sensor Networks (WSN)for air pollution monitoring. Wireless Sensor Networks is an excellent technology that can sense, measure, and gather information from the real world and, based on some local decision process transmit the sensed data to the user. These networks allow the physical environment to be measured at high resolutions, and greatly increase the quality and quantity of real-world data and information for applications like pollution monitoring. Inhaling pollutants for a long time causes damages in human health and the air quality is a major concern in modern cities due to significant impacts of air pollution on global environment, and worldwide economy. To avoid such adverse imbalances in the nature, an air pollution monitoring system is utmost important. Usually the three air pollutants gases including carbon monoxide, carbon dioxide and sulphur dioxide in air because these gases decides the degree of pollution level. Keywords:Air quality monitoring, Wireless sensor networks and Data Aggregation Algorithm(DAA). 1. INTRODUCTION Sensor networks are currently an active research area mainly due to the potential of their applications. In this paper we discussed about the use of Wireless Networks (WSN)for air pollution monitoring. orks is an excellent technology that can sense, measure, and gather information from the real world and, based on some local decision process transmit the sensed data to the user. These networks allow the physical environment to be measured at high resolutions, and greatly increase the tobacco smoke. The effects of air pollution on health have been intensively studied in recent years. Although the urbanization brings a higher economic development, the excessive population concentration environmental damage and pollution like air pollution, noise pollution, water pollution, etc. Among various kinds of pollution, air pollution has a direct impact on our lives, because of the rapid emission of pollutants. Over the past decades, governments of many countries have imposed regulations on air pollutants, so the severe damage brought to human health is reduced considerably. Although there may be no the immediate damage to human lives, however, air pollution still causes some chronic diseases. According to epidemiological studies, the long-term exposure to pollutants may result in the harm to respiratory, nervous and cardiovascular systems. Air cleaning and temperature cooling become more difficult because of the lack of vegetation, and the area will be inevitably influenced by the urban heat tobacco smoke. The effects of air pollution on health have been intensively studied in recent years. Although the urbanization brings a higher economic development, the excessive population concentration will cause 4environmental damage and pollution like air pollution, noise pollution, water pollution, etc. Among various kinds of pollution, air pollution has a direct impact on our lives, because of the rapid emission of pollutants. Over the past decades, governments of many countries have imposed different regulations on air pollutants, so the severe damage brought to human health is reduced considerably. Although there may be no the immediate damage to human lives, however, air pollution still causes some chronic diseases. According to epidemiological stud exposure to pollutants may result in the harm to respiratory, nervous and cardiovascular systems. Air cleaning and temperature cooling become difficult because of the lack of vegetation, and the area will be inevitably influenced by island effect. world data and information for applications like pollution monitoring. Inhaling pollutants for a long time causes damages in uman health and the air quality is a major concern in modern cities due to significant impacts of air pollution on global environment, and worldwide To avoid such adverse imbalances in the nature, an air pollution monitoring system is utmost Usually the three air pollutants gases including carbon monoxide, carbon dioxide and sulphur dioxide in air because these gases decides the Air quality monitoring, Wireless sensor gorithm(DAA). The air we breathe contains emissions from many different sources: industry, motor vehicles, heating and commercial sources, household fuels as well as and commercial sources, household fuels as well as The air we breathe contains emissions from many different sources: industry, motor vehicles, heating @ IJTSRD | Available Online @ www.ijtsrd.com @ IJTSRD | Available Online @ www.ijtsrd.com | Volume – 2 | Issue – 2 | Jan-Feb 2018 Feb 2018 Page: 343
International Journal of Trend in Scientific Research and Development (IJTSRD) ISSN: 2456-6470 2. DATA AGGREGATION ALGORITHM Most wireless 3sensor networks involve the collection of high amounts of data. If we consider the problem to route data packets, representing measurements collected by sensors, to a single managing entity, i.e., a network sink, it is often efficient to exploit the correlation among similar data collected by the sensors in order to decrease overhead. aggregation is a technique which tries to alleviate the localized congestion problem. It attempts to collect useful information from the 5sensors surrounding the event. It then transmits only the useful information to the end point thereby reducing congestion and its associated problems. The algorithm includes two basic operations namely duplicate elimination and data fusion. 2.1. Duplicate Elimination Technique In WAPMS a packet consists of two parts: the data, which is the reading collected by the source node, and an id, which identifies the node uniquely in the network such as a network address. The cluster head collects readings from every node and stores them in a list. After collection, it goes through each item in the list and check for the occurrence of packets with the same id, thereby detecting the presence of duplicate packets. It then keeps only one instance of them. 2.2. Data Fusion Technique There are several statistical methods to summarize a list of data. We have considered the use of the three quartiles - lower, median and upper. We have considered the use of quartiles since they are unaffected by extreme values; this is required in our system whereby extreme and invalid values can sometimes be transmitted to the cluster head and these should not influence the data fusion mechanism. Moreover, quartiles reduce the amount of data to only three values while still reflecting the original data in an accurate way. The novel data fusion algorithm works as follows: 1.The list is partitioned into several smaller groups. We consider the length of the list. We find its multiples in the form (x1, y1), (x2, y2) E.g., length = 200, multiples = (1, 200), (2, 100), (4, 50), (5, 40), (10, 20), (20, 10), (24, 5) We choose the pair which will give the highest number of groups (Maximize x) and the minimum number of elements per group, while keeping it 10Data Figure 1: Wireless Sensor Network Moreover, the crowded tall buildings and heavy transportation also prevent air pollutants from dispersing. This paper proposes an automatic micro- scaled air quality monitoring system for areas with a high density of population and vehicles. The system is based on the 1wireless sensor network technology. The main requirements for the proposed system wireless sensor network system (WAPMS) has 1.Develop an architecture to define nodes and their interaction 2.Collect air pollution readings from a region of interest 3.Collaboration among thousands of nodes to collect readings and transmit them to a gateway all the while minimizing the amount of duplicates and invalid values 4.Use of appropriate data aggregation to reduce the power consumption during transmission oflarge amount of data between the thousands of nodes At present, our scientific understanding of air pollution is not sufficient to be able to accurately predict air quality. Analysis of monitoring data allows us to assess how bad air pollution is from day to day, which areas are worse than others and whether levels are rising or falling. We can see how pollutants interact with each other and how they relate to traffic levels or industrial activity. By analyzing the relationship between meteorology and air quality, we can predict which weather conditions will give rise to pollution episodes. 6air pollution monitoring @ IJTSRD | Available Online @ www.ijtsrd.com | Volume – 2 | Issue – 2 | Jan-Feb 2018 Page: 344
International Journal of Trend in Scientific Research and Development (IJTSRD) ISSN: 2456-6470 Reading Sensor: Generates a random value whose range is set based on the value of a “seriousness” variable. Reading Transmitter: Gets the generated value from the reading sensor and transmits it through the communicator. Power Controller: Each node will have a method called “turn on” that will start the node and we just call it. As for power-saving modes, this will depend on what the simulator will Provide to us. Communicator: This is implemented by the simulator. Inter-Process communication is Usually done using sockets; so, we expect the simulator to provide us with sockets as Well as methods such as “send” and “receive”. Launcher: Informs the data collector to start collection based on the delivery mode set bythe user. Data Collector: Gets a list of nodes from which it has to collect readings, then sends messages to inform them and finally receives the required values. Aggregator: Implements the RCQ algorithm for data aggregation that we will discuss in the next section. Data Extractor: Use SQL queries to extract data from database Data Displayer: This extracts data as required by the user and displays them in a table as well as evaluates the AQI for the selected area. Trend Analyzer: Gets previous readings and determines relationship between them to be able to extrapolate future readings. Nodes Deployment deployment of nodes in the WSN field and their AQI colors. Connection Initiator: The java Driver Manager allows for a method to open a database providing it the name of the database, user name and password as parameters. So, this component just has to make a call to this method and store the return reference to the connection. Connection Destructor: Connection object, injava.sql package, usually provides for a close method that closes the latter safely and frees associated memory as well as save state of the latter. Therefore, this component just has to call this method. above a threshold Minimize y, y > threshold value) E.g., length = 50, multiples = (1, 50), (2, 25), (5, 10), (10, 5), threshold = 5, optimal pair = (10, 5) 2.We calculate the quartiles for each of the smaller lists 3.Merge the resulting quartiles for the sub lists into one list 4.Repeat the whole process until the eventual number of groups, in which the list can be broken, becomes one and the final list obtained has only three values. 3. WAPMS (wireless sensor network air pollution monitoring system) The wireless sensor network air pollution 9monitoring system (WAPMS) comprises of an array of sensor nodes and a communications system which allows the data to reach a server. The sensor nodes gather data autonomously and the data network is used to pass data to one or more base stations, which forward it to a sensor network server. The system send commands to the nodes in order to fetch the data, and also allows the nodes to send data out autonomously. Below shows the architecture diagram of WAPMS. Viewer: Displays Figure2: ArchitecturediagramofWAMPS Below is a brief description of each component of WAMPS: @ IJTSRD | Available Online @ www.ijtsrd.com | Volume – 2 | Issue – 2 | Jan-Feb 2018 Page: 345
International Journal of Trend in Scientific Research and Development (IJTSRD) ISSN: 2456-6470 There are three types of nodes that are present in WAPMS. They are Source or Sensor node, Cluster Head or Collector and Sink/Gateway. There are some strategy to deploy the WSN for the system so we first partition our region of interest into several smaller areas for better management of huge amount of data that will be collected from the system and for better coordination of the various components involved and we deploy one cluster head in each area; these will form cluster with the nodes in their respective areas, collect data from them, perform aggregation and send these back to the sink. Then randomly deploy the sensor nodes in the different areas. These will sense the data, send them to the cluster head in their respective area through multi-hop routing and will use multiple sinks that will collect aggregated from the cluster heads and transmit them to the gateway. Each sink will be allocated a set of cluster heads. The gateway will collect results from the sinks and relay them to the database and eventually to our application. Table 1: Categorization of Air Quality WAMPS has been simulated using the 7Jist/Swans simulator. SWANS is a scalable wireless network simulator built atop the Jist platform. SWANS is organized as independent software components that can be composed to form complete wireless network or sensor network configurations. The 2DSRprotocol has been used for data transmission in WAPMS. The Dynamic Source Routing protocol is a simple reactive routing protocol designed specifically for use in multi-hop wireless ad hoc networks. 8DSR contains two phases: Route Discovery (find a path) and Route Maintenance (maintain a path). After a collection, the system displays the nodes in their corresponding AQI color based on these AQI color the government to devise an indexing system to categorize air pollution and to evaluate the level of to evaluate the level of health concern for a specific area. 4. CONCLUSION Figure 3: Nodes in WAPMS An Air Quality Index (AQI) is used in WAMPS. The AQI is an indicator of air quality, based on Air pollutants that have adverse effects on human health and the environment. The AQI consists of 6 categories, each represented by a specific color and indicating a certain level of health concern and is it shown in table. Here we use wireless sensor network technologies to acquire and record monitoring data for the goal of completely automatic WAPMS will be very beneficial for monitoring different high risk regions of the country. It will provide real-time information about the level of air pollution in these regions, as well as provide alerts in cases of drastic change in quality of air. This information can then be used by the authorities to take prompt actions such as evacuating people or sending emergency response team. WAPMS uses an Air air-quality monitoring. @ IJTSRD | Available Online @ www.ijtsrd.com | Volume – 2 | Issue – 2 | Jan-Feb 2018 Page: 346
International Journal of Trend in Scientific Research and Development (IJTSRD) ISSN: 2456-6470 5.Q. Cao, T. He, L. Fang, T. Abdelzaher, J. Stankovic, and S. Son, “Efficiency Centric Communication Model for Wireless Sensor Networks”, in Proceedings of IEEE INFOCOM, pp. 1-12, 2006. Quality Index to categorize the various levels of air pollution. It also associates meaningful and very intuitive colors to the different categories, thus the state of air pollution can be communicated to the user very easily. WAPMS uses a novel technique to do data aggregation in order to tackle the challenge of power consumption minimization in WSN. Another strength of WAPMS is the high quality of results it produces. The collected readings are saved in a database. The table uses the AQI to provide the results using the associated colors and it also provided the level of health concern for a particular area. WAPMS is very flexible, very easy and yet very powerful due to its ability to provide highly summarized results as well as fine-grain results at the level of sensors. 6.Kavi K. Khedo, Rajiv Perseedoss and Avinash Mungur “A Wireless Sensor Network Air Pollution Monitoring System”, International Journals of Wireless And Mobile Networks, Vol.2, No. 2, May 2010. 7.JiST/SWANS, Java in Simulation Time / Scalable Wireless Ad hoc Network Simulator, Available from: http://jist.ece.cornell.edu/index.html, Cornell University. 8.D. Johnson, D. Maltz, and J. Broch, “DSR: The Dynamic Source Routing Protocol for Multi-Hop Wireless Ad Hoc Networks”, In Ad Hoc Networking, Chapter 5, 139-172, Addison- Wesley, 2001. REFERENCES 1.F. Akyilidiz et al, Wireless Sensor Networks: A Survey,Computer Networks,March 2002 2.H. Karl and A. Willig, Protocols and Architectures for Wireless Sensor Networks, John Wiley and Sons Ltd, The Atrium, Southern Gate, Chichester, West Sussex, England, 2005. 9.A. Mainwaring , D. Culler , J. Polastre , R. Szewczyk , J.Anderson, Wireless sensor networks for habitat monitoring, Proceedings of the 1st ACM international workshop on Wireless sensor networks and applications, Atlanta, Georgia, USA, September 2002. 3.D. Culler, D. Estrin, and M. Srivastava, “Overview of Sensor Networks”, IEEE Computer, August 2004. 10.R. Rajagopalan and P.K. Varshney, “Data- Aggregation Techniques in Sensor Networks: A Survey,” IEEE Communication Surveys and Tutorials, Vol. 8 (4), pp. 48-63, December 2006. 4.K. Martinez, J. K. Hart, and R. Ong, “Environmental sensor Computer Journal, Vol. 37 (8), 50-56, August 2004. networks”, IEEE @ IJTSRD | Available Online @ www.ijtsrd.com | Volume – 2 | Issue – 2 | Jan-Feb 2018 Page: 347