Download

1 / 17
200 likes | 525 Views
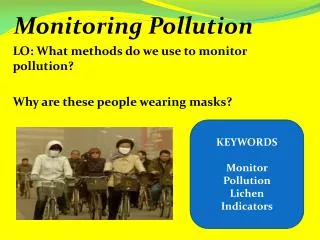
Monitoring the air pollution. In October 2007 a group of students and teachers in our school started working within the Comenius project. One of our aims in the project is monitoring the air pollution in our city.

E N D
Monitoring the air pollution In October 2007 a group of students and teachers in our school started working within the Comenius project. One of our aims in the project is monitoring the air pollution in our city. We owe all the data to the Regional Inspectorate of Environmantal Protection as this institution carries out detailed research on the level of air pollution. From September 2007 to December 2008 we were checking the amounts of different pollutants in the air, such as sulphur dioxide, nitrogen oxide, nitrogen dioxide, carbon oxide, ozon and atmospheric particulates. Parameters established exceed their quotas very often, especially in winter when a lot of harmful materials are burnt in order to obtain heat.
Automatic air quality monitoring station in Dabrowa Gornicza INFORMATION ABOUT AIR MONITORING STATION no 12.007 National code of the station: SlDabroDabr_1000L Area: The Upper Silesian Aglomeration Address: Dabrowa Gornicza, 1000-lecie 25a Street
Automatic air quality monitoring station in Dabrowa Gornicza Air pollution parameters measured at the station: Sulphur dioxide Nitrogen dioxide Nitrogen oxide Nitrogen oxides Carbon oxide Ozon benzen, toluene, xylene, M-P-xylene Atmospheric particulates PM10
Automatic air quality monitoring station in Dabrowa Gornicza Meteorological parameters: wind direction wind speed air temperature relative humidity total radiation UV radiation atmospheric pressure precipitation
INFORMATION ABOUT THE LOCATION OF THE STATION: Type of the area: urban (residential, industrial) Latitude: 50o 20’ N Longitude: 19o 14’ E Type of surrounding’s protection: common Urban type: city 50 000÷250 000 Location of the station: The station is located in south-western part of Dabrowa Gornicza in the district Golonog on kindergarden premises. In north-eastern and southern part of the location of the station there are four-storeyand ten-storey blocks of flats with central heating. East off the station at the distance of about 800 m there is a busy motorway and farther there are industrial areas of steelworks “Arcelor Mittal” and cokingplant “Friendship”.
Sulphur dioxide Sulphur dioxide passes a limit - 20 µg/m3. In November 2007 – 27 µg/m3 , December 2007 – 37 µg/m3 , January 2008 – 28 µg/m3, February 2008 - 24 µg/m3 , November 2008 – 21 µg/m3 and December 2008 – 23 µg/m3 . It was caused by bigger demand for energy and heat.
Nitrogen oxide The highest level of nitrogen oxide was in October 2008 – 27 µg/m3 , but it did not exceed itsquota. The main source of nitrogen oxide are car fumes.
Nitrogen dioxide Nitrogen dioxide passes a limit – 40 µg/m3. In November 2007 – 51 µg/m3 , December 2007 – 54 µg/m3 , January 2008 – 46 µg/m3 , February 2008 – 43 µg/m3 and October 2008 – 41 µg/m3 .
Ozon The highest level of ozon was in June 2008 – 58,7 µg/m3 but it did not exceed the quota and its lowest level was in December 2007 - 7 µg/m3
Carbon oxide The highest level of carbon oxide was in December 2007 – 1,48 µg/m3 , but it was did not exceed the quota and its lowest level was in July 2008.
Atmospheric particulates Atmospheric particulates pass a limit - 40 µg/m3. In October 2007 – 51 µg/m3 , November 2007 – 67 µg/m3 , December 2007 – 73 µg/m3, January 2008 -63 µg/m3 February 2008 - 69 µg/m3 , March 2008 – 44 µg/m3 April 2008 – 53 µg/m3 and May -58 µg/m3
To reduce the emission of greenhouse gases and oxides we must put ecological filters on the chimneys of steelworks and factories and use gas installations in our houses and cars.Air pollution has been a big problem for people living in our region for many years. This problem causes illnesses like pneumonia, allergy and others.Thanks to higher and higher people’s awareness we can succeed in reducing the level of pollution.
All graphs were made by us according to the official data source which is http://stacje.katowice.pios.gov.pl/iseo/ This presentation was made in December 2008 by Marta Batko, Aleksandra Dziewierska, Jakub Kaczor. The project was realized with the financial support from the European Committee within Comenius Lifelong Learning Programme.The contents of the programme or materials do not reflect the stand of the European Committee.The publisher is responsible for the contents of all publications.The European Committee bears no responsibility for the use of this information in any way.