Download
1 / 4
40 likes | 63 Views
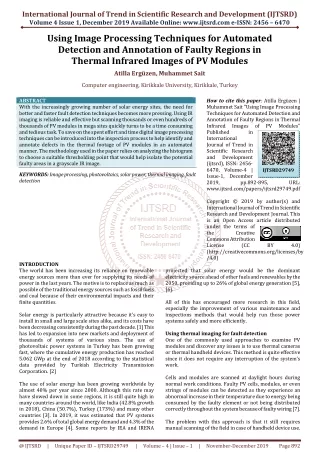
With the increasingly growing number of solar energy sites, the need for better and faster fault detection techniques becomes more pressing. Using IR imaging is reliable and effective but scanning thousands or even hundreds of thousands of PV modules in mega sites quickly turns to be a time consuming and tedious task. To save on the spent effort and time digital image processing techniques can be introduced into the inspection process to help identify and annotate defects in the thermal footage of PV modules in an automated manner. The methodology used in the paper relies on analyzing the histogram to choose a suitable thresholding point that would help isolate the potential faulty areas in a grayscale IR image. Atilla Ergu00bczen | Muhammet Sait "Using Image Processing Techniques for Automated Detection and Annotation of Faulty Regions in Thermal Infrared Images of PV Modules" Published in International Journal of Trend in Scientific Research and Development (ijtsrd), ISSN: 2456-6470, Volume-4 | Issue-1 , December 2019, URL: https://www.ijtsrd.com/papers/ijtsrd29749.pdf Paper URL: https://www.ijtsrd.com/engineering/computer-engineering/29749/using-image-processing-techniques-for-automated-detection-and-annotation-of-faulty-regions-in-thermal-infrared-images-of-pv-modules/atilla-ergu00fczen<br>

E N D
International Journal of Trend in Scientific Research and Development (IJTSRD) Volume 4 Issue 1, December 2019 Available Online: www.ijtsrd.com e-ISSN: 2456 – 6470 Using Image Processing Techniques for Automated Detection and Annotation of Faulty Regions in Thermal Infrared Images of PV Modules Atilla Ergüzen, Muhammet Sait Computer engineering, Kirikkale University, Kirikkale, Turkey ABSTRACT With the increasingly growing number of solar energy sites, the need for better and faster fault detection techniques becomes more pressing. Using IR imaging is reliable and effective but scanning thousands or even hundreds of thousands of PV modules in mega sites quickly turns to be a time consuming and tedious task. To save on the spent effort and time digital image processing techniques can be introduced into the inspection process to help identify and annotate defects in the thermal footage of PV modules in an automated manner. The methodology used in the paper relies on analyzing the histogram to choose a suitable thresholding point that would help isolate the potential faulty areas in a grayscale IR image. KEYWORDS: Image processing, photovoltaics, solar power, thermal imaging, fault detection How to cite this paper: Atilla Ergüzen | Muhammet Sait "Using Image Processing Techniques for Automated Detection and Annotation of Faulty Regions in Thermal Infrared Images Published in International Journal of Trend in Scientific Research and Development (ijtsrd), ISSN: 2456- 6470, Volume-4 | Issue-1, December 2019, pp.892-895, www.ijtsrd.com/papers/ijtsrd29749.pdf Copyright © 2019 by author(s) and International Journal of Trend in Scientific Research and Development Journal. This is an Open Access article distributed under the terms of the Creative Commons Attribution License (CC (http://creativecommons.org/licenses/by /4.0) of PV Modules" IJTSRD29749 URL: BY 4.0) INTRODUCTION The world has been increasing its reliance on renewable energy sources more than ever for supplying its needs of power in the last years. The motive is to replace as much as possible of the traditional energy sources such as fossil fuels and coal because of their environmental impacts and their finite quantities. Solar energy is particularly attractive because it’s easy to install in small and large scale sites alike, and its costs have been decreasing consistently during the past decade. [1] This has led to expansion into new markets and deployment of thousands of systems of various sizes. The use of photovoltaic power systems in Turkey has been growing fast, where the cumulative energy production has reached 5.062 GWp at the end of 2018 according to the statistical data provided by Turkish Electricity Transmission Corporation. [2] The use of solar energy has been growing worldwide by almost 40% per year since 2000. Although this rate may have slowed down in some regions, it is still quite high in many countries around the world, like India (42.8% growth in 2018), China (50.7%), Turkey (173%) and many other countries [3]. In 2019, it was estimated that PV systems provides 2.6% of total global energy demand and 4.3% of the demand in Europe [4]. Some reports by IEA and IRENA projected that solar energy would be the dominant electricity source ahead of other fuels and renewables by the 2050, providing up to 26% of global energy generation [5], [6]. All of this has encouraged more research in this field, especially the improvement of various maintenance and inspections methods that would help run those power systems safely and more efficiently. Using thermal imaging for fault detection One of the commonly used approaches to examine PV modules and discover any issues is to use thermal cameras or thermal handheld devices. This method is quite effective since it does not require any interruption of the system’s work. Cells and modules are scanned at daylight hours during normal work conditions. Faulty PV cells, modules, or even strings of modules can be detected as they experience an abnormal increase in their temperature due to energy being consumed by the faulty element or not being distributed correctly throughout the system because of faulty wiring [7]. The problem with this approach is that it still requires manual scanning of the field in case of handheld device use. @ IJTSRD | Unique Paper ID – IJTSRD29749 | Volume – 4 | Issue – 1 | November-December 2019 Page 892
International Journal of Trend in Scientific Research and Development (IJTSRD) @ www.ijtsrd.com eISSN: 2456-6470 The alternative is to mount a thermal camera to a UAV (unmanned aerial vehicle) and fly it in a specified route to cover the power plant entirely. This new approach has become more appealing recently because of the increasing availability of various models of drones and quadcopters which are both affordable and powerful enough to carry the imaging device for a sufficient period of time. However, the footage gathered by the UAV is still manually inspected to identify any present problems in the scanned modules. Digital image processing for detecting faults Many studies in the literature has discussed different approaches for fault detection using image processing techniques. In [9], Canny edge detection is used to identify hot spots in gray thermal images. To reduce the noise in the obtained images, smoothing and Gaussian filtering is introduced. For aerial imagery with insufficient GSD (ground sampling distance) this would erase many smaller potential fault areas. Environmental conditions affect the quality of the imaging process, most notably wind which can cause blurring due to disrupts in UAV stability, and the reflection of solar rays on modules’ surfaces which results in over illuminated images [8]. These elements make it more difficult to detect hot spots using edge detection or other algorithms that would require low noise levels in the images. In [11], four sets of features are computed (module medians, grid cell medians, histogram skewness, and vertical projections) for PV modules detected in the thermal images. They detect the defective modules based on temperature abnormalities by conducting a Dixon’s Q test after a Grubbs’ test. In another study [12], the panel areas are extracted from the UAV thermal images and a methodology for automatic fault detection is proposed using statistical values of thermal intensity of each solar panel. Another method is based on curve fitting of gray thermal images’ histogram suggested by [13]. Using the least square method, the histogram is fitted as a smooth curve eliminating the blurs and local fluctuations present in the image. A threshold is then selected based on the curve characteristics in a way that would isolate the hot spots from the rest of the image. In this work we rely on histogram analysis to select a threshold point that would partition the image and isolate the regions of interest (i.e. hot spots) in a way similar to the method used in the curve fitting study. The threshold is calculated from the image histogram using the following formula, adapted from [13], and it represents the last “valley” before the first significant “peak” in the histogram curve: eq (1) ; ; is the abscissa of the highest peak in the histogram is abscissa of all the “valleys” This is assuming that the darker the pixel is the higher the temperature is; which corresponds to the format of the dataset images studied in this paper [10]. The steps of the complete algorithm used to process the data are as follows: 1.PV strings extraction: Isolate the solar modules from the background; 2.Calculate the histogram for the isolated foreground image only; 3.Select a threshold point; 4.Convert foreground image into BW using previous threshold; 5.Highlight the resulting black spots in the original image. Experimental Results We tested our method on a thermal dataset of a solar field installation which was collected in Switzerland by an eBee Classic drone carrying a sense Fly thermo MAP camera. The dataset consists of thermal images saved in grayscale. Ground resolution (GSD) Coverage Flight height Table1 Technical information of the image dataset We applied the proposed method on a number of the frames in the dataset. In all of the tested images the total faulty area was <= 5% of the total area of the inspected solar modules. Hotspots where represented by darker areas than the average color tone of healthy PV cells due to their higher temperatures compared to normally functioning cells. It is crucial for the defective areas to be relatively small, since the method used is assuming that the pixels with the highest frequency of gray level represent healthy areas. Under these conditions the histogram of the image (minus any background) takes a shape that clearly identifies the faulty pixels. 14.23 cm (5.6 in)/px 0.08 sq. km (0.03 sq. mi) 70 m (229.6 ft) @ IJTSRD | Unique Paper ID – IJTSRD29749 | Volume – 4 | Issue – 1 | November-December 2019 Page 893
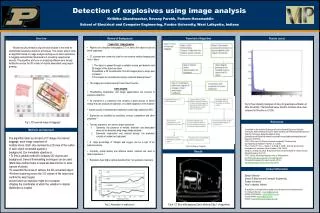
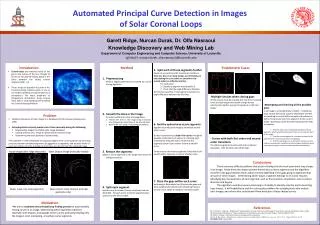
International Journal of Trend in Scientific Research and Development (IJTSRD) @ www.ijtsrd.com eISSN: 2456-6470 Figure1 A sample image from the dataset (left), isolated modules with background pixels filled with white (right, border was added for clarity). In Figure1 A sample image from the dataset (left), isolated modules with background pixels filled with white (right, border was added for clarity). a sample image from the dataset is preprocessed, to isolate the module strings from any other objects in the image. This step is required since we need to apply the next steps on the histogram of the pixels that represent solar modules only. Next step can be understood clearly by investigating the histogram of the gray pixels that we have from step 1. In Error! Reference source not found., we have the histogram corresponding to the image shown earlier, with a zoomed in section to further illustrate our region of interest. In this particular example, the optimal threshold point would have a gray value of 68. Accordingly, we continue to partition the image with all pixels that have gray values darker than 68 turned into black, and everything else turned white. Figure2 Histogram of the cropped modules image ignoring white pixels (left), Zoomed-in section of the histogram focusing on the region of interest (right). After applying this threshold, we acquire an image which only contains potential fault locations. Since these areas still correspond to their original locations on the starting image, we can highlight these regions in the original image and display it to the end user. @ IJTSRD | Unique Paper ID – IJTSRD29749 | Volume – 4 | Issue – 1 | November-December 2019 Page 894
International Journal of Trend in Scientific Research and Development (IJTSRD) @ www.ijtsrd.com eISSN: 2456-6470 Due to the high altitude of the images taken the faulty areas can be quite small. This has limited our ability to apply any useful noise reduction steps during the preprocessing of the images since it may result in losing some of the small hot spot areas. We opted for an increased number of false positives in our results instead. Despite that, we found in our tests that the ratio of false positives to correctly marked areas to be less than 14%. We expect this to improve in case of application on higher resolution imagery or lower altitude flights which would result in a better ground resolution. Conclusions Automated detection of hot spots in PV modules using histogram analysis is studied in the paper. Experimentation was done on a dataset of grayscale thermal images of a solar installation site taken by a drone. Hot spots are isolated using thresholding based on the histogram of each image. This method gives good results under certain conditions, most importantly the defect areas should be a minority compared to the whole inspected area. However, it is simple and quite effective compared to other methods in this research area. References [1]S. E. I. Association, “Solar Industry Research Data,” 2019. [Online]. Available: https://www.seia.org/solar- industry-research-data. [Accessed: 14-Dec-2019]. 2014. [6]I. R. E. A. (IRENA), “GLOBAL ENERGY TRANSFORMATION,” 2018. [7]M. Cubukcu and A. Akanalci, “Real-time inspection and determination methods of faults on photovoltaic power systems by thermal imaging in Turkey,” Renew. Energy, vol. 147, pp. 1231–1238, 2020. [8]M. Aghaei, A. Dolara, S. Leva, and F. Grimaccia, “Image resolution and defects detection in PV inspection by unmanned technologies,” in 2016 IEEE Power and Energy Society General Meeting (PESGM), 2016, pp. 1–5. [9]J. A. Tsanakas, D. Chrysostomou, P. N. Botsaris, and A. Gasteratos, “Fault diagnosis of photovoltaic modules through image processing and Canny edge detection on field thermographic measurements,” Int. J. Sustain. Energy, vol. 34, no. 6, pp. 351–372, 2015. [10]SenseFly, “Solar Panel Installation.” [Online]. Available: https://www.sensefly.com/education/datasets/?datas et=1416. [Accessed: 14-Dec-2019]. [11]S. Dotenco et al., “Automatic detection and analysis of photovoltaic modules in aerial infrared imagery,” in 2016 IEEE Winter Conference on Applications of Computer Vision (WACV), 2016, pp. 1–9. [12]D. Kim, J. Youn, and C. Kim, “AUTOMATIC FAULT RECOGNITION OF PHOTOVOLTAIC MODULES BASED ON STATISTICAL THERMOGRAPHY,” Int. Arch. Photogramm. Remote Sens. Spat. Inf. Sci., vol. XLII-2/W6, pp. 179–182, Aug. 2017. [2]T. electricity transmission Corporation, “Installation of Electricity Systems in Turkey and Installed Power by Resource,” 2018. https://www.teias.gov.tr/sites/default/files/2019- 01/kurulu_guc_aralik_2018.pdf. [Accessed: 14-Dec- 2019]. ANALYSIS OF UAV [Online]. Available: [13]J. Lin, S. Jianhui, and L. Xin, “Hot spots detection of operating PV arrays through IR thermal image using method based on curve fitting of gray histogram,” MATEC Web Conf., vol. 61, 2016. [3]B. P. l. c., “BP Statistical Review of World Energy,” 2019. [4]I. PVPS, “PVPS Snapshot of Global PV Markets,” 2019. [5]I. E. Agency, “Energy Technology Perspectives 2014,” @ IJTSRD | Unique Paper ID – IJTSRD29749 | Volume – 4 | Issue – 1 | November-December 2019 Page 895