Download
1 / 45
470 likes | 631 Views
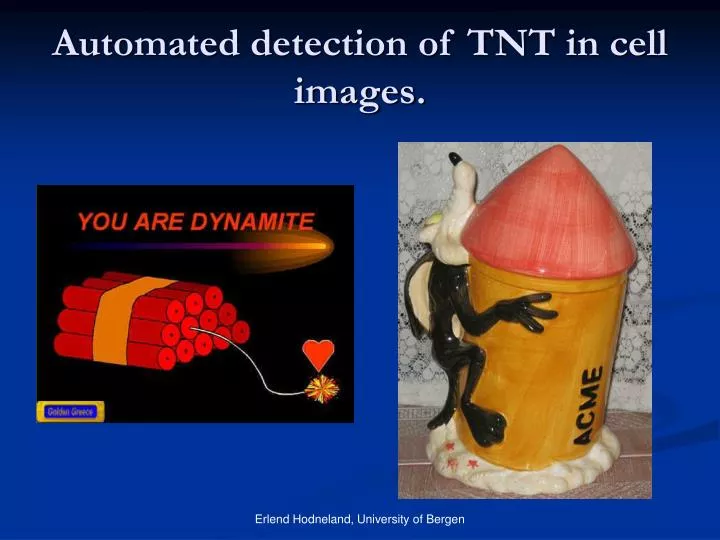
Automated detection of TNT in cell images. Automated detection of TNT in cell images. Automated detection of TNTs( T unnelling N ano T ubes) in cell images. Automated detection of TNTs( T unnelling N ano T ubes) in cell images. Erlend Hodneland, Arvid Lundervold, Xue-Cheng Tai,

E N D
Automated detection of TNT in cell images. Erlend Hodneland, University of Bergen
Automated detection of TNT in cell images. Erlend Hodneland, University of Bergen
Automated detection of TNTs(Tunnelling NanoTubes) in cell images Erlend Hodneland, University of Bergen
Automated detection of TNTs(Tunnelling NanoTubes) in cell images Erlend Hodneland, Arvid Lundervold, Xue-Cheng Tai, Steffen Gurke, Amin Rustom, Hans-Hermann Gerdes. Erlend Hodneland, University of Bergen
3D session at fluorescence microscope • Dimension : 520x688x40 • Better resolution in xy plane than in z direction. Erlend Hodneland, University of Bergen
Two image channels • The channels appear from biological stainings of sample. • The stainings are photo sensible to specific wavelengths and accumulate in certain compartmens of the cells. Erlend Hodneland, University of Bergen
First channel displaying cell borders and TNTs Erlend Hodneland, University of Bergen
Gaussian noise and undesired structures Erlend Hodneland, University of Bergen
Video of image stack Erlend Hodneland, University of Bergen
Second channel displaying cell cytoplasma Erlend Hodneland, University of Bergen
Biological relevance of TNTs • TNTs are until recently unknown cell structures. • Play a role in cell to cell communication. • Transport of virus? • Spread of cancer? Cell 1 Cell 2 Virus moving? Erlend Hodneland, University of Bergen
Automated detection of TNTs • A very challenging problem due to large variability between images. • The basis methods are built up around • Zerocross and Canny edgedetectors. • Morphology incl. Watershed segmentation, binary filling, dilation, erosion, closing and opening. Erlend Hodneland, University of Bergen
Morhpological operators* *Serra, J 1982, Image analysis and mathematical morphology., Academic Press. Erlend Hodneland, University of Bergen
Morhpological operators* *Serra, J 1982, Image analysis and mathematical morphology., Academic Press. Erlend Hodneland, University of Bergen
Morhpological operators* *Serra, J 1982, Image analysis and mathematical morphology., Academic Press. Erlend Hodneland, University of Bergen
Morhpological operators* *Serra, J 1982, Image analysis and mathematical morphology., Academic Press. Erlend Hodneland, University of Bergen
Morhpological operators* *Serra, J 1982, Image analysis and mathematical morphology., Academic Press. Erlend Hodneland, University of Bergen
Step #1 : Find cellular regions • Using canny edge detector to find borders of cells. • Edge detectors create lots of broken parts, we need to combine these parts. Erlend Hodneland, University of Bergen
Step #1 : Find cellular regions • Use morphological closing and dilation to combine edges into closed regions. Dilation and closing Erlend Hodneland, University of Bergen
Step #1 : Find cellular regions • Use morphological filling to fill closed regions. • Cells shown as white, filled regions. Filling Erlend Hodneland, University of Bergen
Step #1 : Find cellular regions • 3-D representation of binary cell image. Combine All planes. Erlend Hodneland, University of Bergen
Step #2 Find important edges in cell border channel • The first channel displays TNTs and cell borders. • TNTs have low intensities compared to cell borders but they have a large gradient. Erlend Hodneland, University of Bergen
Step #2 Find important edges in cell border channel • Remove edges inside cells. Erlend Hodneland, University of Bergen
Watershed segmentation • A segmentation procedure specially designed for images with natural minima. • A reliable segmentation method, but it needs suitable minima regions as input for the region growing. Cell Cell Background Erlend Hodneland, University of Bergen
Watershed segmentation Region 1 min(W(a,b)) • Pathwise criterion of Watershed lines W: For all Ai(a,b), min(W(a,b)) ≥ min(Ai(a,b)) ”Moving on the top of the hill” a b min(Ai(a,b)) Region 2 Region 3 Erlend Hodneland, University of Bergen
Watershed segmentation • The minima seeding regions are extremely important and decide where the watershed lines will appear. Minima regions Minima imposed on image Erlend Hodneland, University of Bergen
Watershed segmentation • Results improve when the minima seeding regions are close to the crest of the desired structures. Watershed image, {1,2 … 7} The boundaries of cells 1 6 2 4 5 3 7 Erlend Hodneland, University of Bergen
Watershed segmentation • Results improve when the minima seeding regions are close to the crest of the desired structures. Watershed image, {1,2 … 7} The boundaries of cells 1 6 2 4 5 3 7 Erlend Hodneland, University of Bergen
Step #3 Watershed segmentation to find crest of structures from edges • TNTs are thin and narrow, approximately 3-4 pixles wide (50-200nm). 1 1 TNT Erlend Hodneland, University of Bergen
Step #3 Watershed segmentation to find crest of structures from edges • Problem : The structures from the edge image are not always continuous and they are not marking the crest of the structure. • Solution : Use watershed segmentation to create connected lines on the crest of the high intensity structures. Erlend Hodneland, University of Bergen
Step #3 Watershed segmentation to find crest of structures from edges • Problem : The structures from the edge image are not always continuous and they are not marking the crest of the structure. TNT 1 1 Erlend Hodneland, University of Bergen
Step #3 Watershed segmentation to find crest of structures from edges • Important: TNTs can cross several planes. • Therefore we use a projection in 3-D 2-D to include the whole TNT. • All projections are ranging over the same planes as the structure we investigate. z 20 TNT Cell 2 Cell 1 10 y x Erlend Hodneland, University of Bergen
Step #3 Watershed segmentation to find crest of structures from edges Plane 10 Plane 11 Plane 13 Plane 12 Erlend Hodneland, University of Bergen
Step #3 Watershed segmentation to find crest of structures from edges • Using the maximum projection of the structure from the edge image to take advantage of 3-D information. TNT Maximum projection and closing 1 Erlend Hodneland, University of Bergen
Step #3 Watershed segmentation to find crest of structures from edges • We use information from the segmentation of cells to construct minima regions to seed the Watershed segmentation. TNT Background Cells Erlend Hodneland, University of Bergen
Step #3 Watershed segmentation to find crest of structures from edges • We use information from the segmentation of cells to construct minima regions to seed the Watershed segmentation. TNT Impose (1) on (2) Morphological opening Minima regions 1 2 Erlend Hodneland, University of Bergen
Step #3 Watershed segmentation to find crest of structures from edges • For Watershed we use the sum projection of the image to take advantage of 3-D information and for Gaussian noise supression. TNT Sum projection Image stack Erlend Hodneland, University of Bergen
Step #3 Watershed segmentation to find crest of structures from edges • Using Watershed segmentation to achieve a connected line on the crest of the structure from the edge image. TNT Minima regions Watershed segmentation TNT Erlend Hodneland, University of Bergen
Step #4 Removal of false TNT candidates • We end up with numerous TNT candidates, some false and some true. Watershed segmentation TNT candidates Erlend Hodneland, University of Bergen
Step #4 Removal of false TNT candidates • Each TNT candidate must undergo an evaluation of correctedness. Remove candidates • having low intensities compared to their surroundings. • not crossing between two cells. • not beeing straigth lines using hough transformation. • crossing at the nearest distance of the cells. • We are left with ”true” TNT structures after the exclusion evaluation. Erlend Hodneland, University of Bergen
Results • We have employed our algorithm to 51 3-D image stacks: • Success rate 67% • False positive 50% • False negative 33% compared to manual counting. • The high number of false positive TNTs is mostly due to large image variations and irregularities of the cells. Erlend Hodneland, University of Bergen
Results • Large irregularites. • Main reason for false positive or false negative TNTs. Erlend Hodneland, University of Bergen
Results • Large irregularites. • Main reason for false positive or false negative TNTs. Erlend Hodneland, University of Bergen
Results • Nano experiments to grow the cells on pre-defined matrices. • This will improve the automated detection. Erlend Hodneland, University of Bergen
Conclusion • We have developed an automated method for counting TNTs in cell images. • The method is essentially based on existing image processing techniques like edge-detectors, watershed segmentation and morphological operators. • We report a success rate of 67% compared to manual counting. Erlend Hodneland, University of Bergen