Download
1 / 6
60 likes | 64 Views
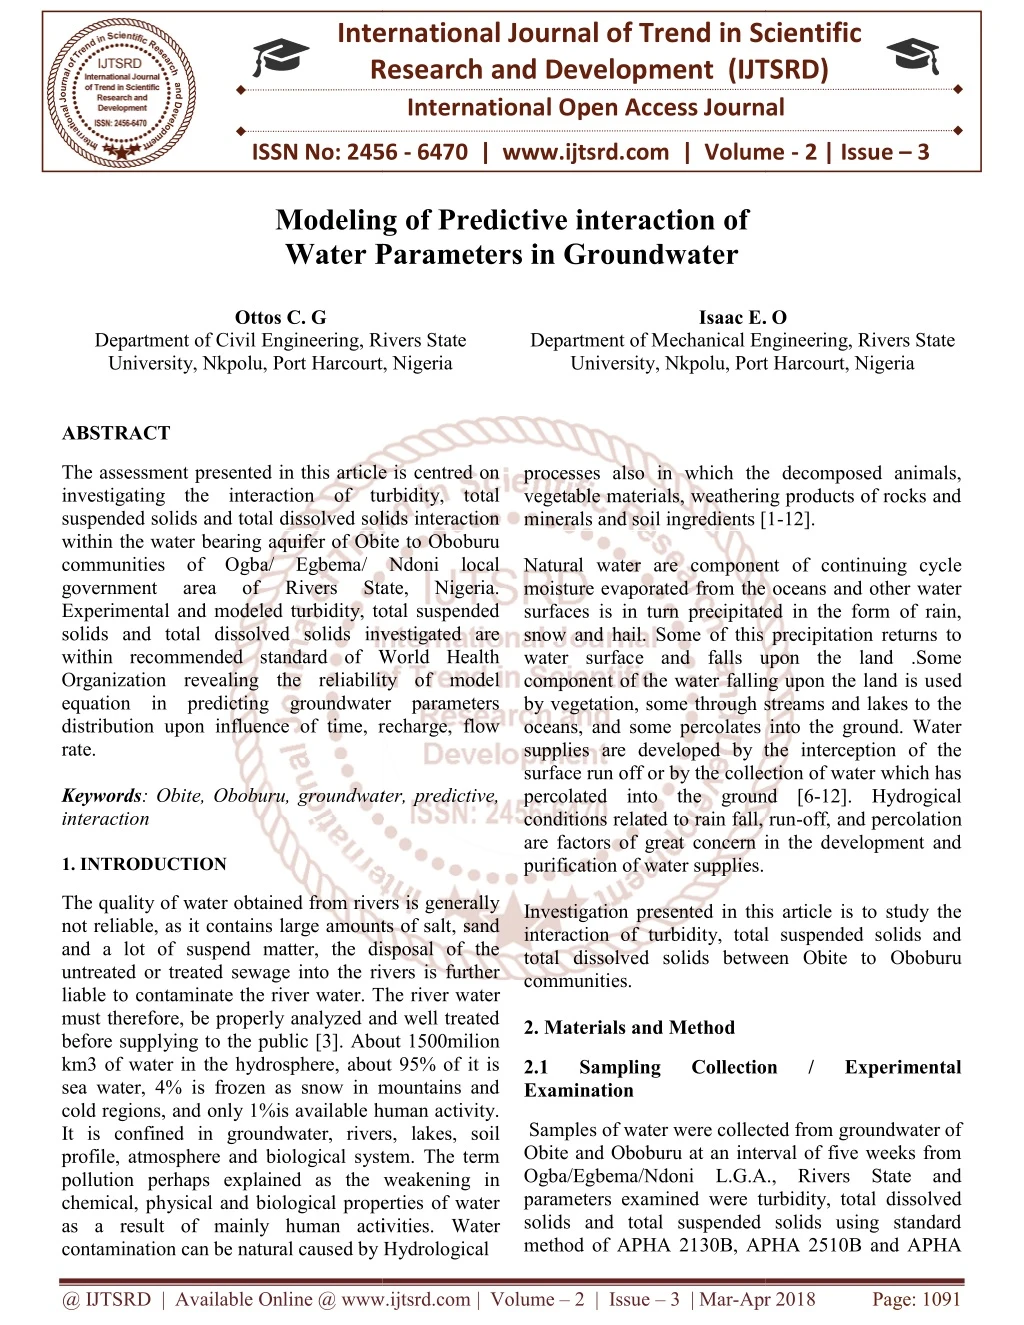
The assessment presented in this article is centred on investigating the interaction of turbidity, total suspended solids and total dissolved solids interaction within the water bearing aquifer of Obite to Oboburu communities of Ogba Egbema Ndoni local government area of Rivers State, Nigeria. Experimental and modeled turbidity, total suspended solids and total dissolved solids investigated are within recommended standard of World Health Organization revealing the reliability of model equation in predicting groundwater parameters distribution upon influence of time, recharge, flow rate. Ottos C. G | Isaac E. O "Modeling of Predictive interaction of Water Parameters in Groundwater" Published in International Journal of Trend in Scientific Research and Development (ijtsrd), ISSN: 2456-6470, Volume-2 | Issue-3 , April 2018, URL: https://www.ijtsrd.com/papers/ijtsrd11292.pdf Paper URL: http://www.ijtsrd.com/engineering/civil-engineering/11292/modeling-of-predictive-interaction-of-water-parameters-in-groundwater/ottos-c-g<br>

E N D
International Research Research and Development (IJTSRD) International Open Access Journal ng of Predictive interaction of Water Parameters in Groundwater International Journal of Trend in Scientific Scientific (IJTSRD) International Open Access Journal ISSN No: 2456 ISSN No: 2456 - 6470 | www.ijtsrd.com | Volume 6470 | www.ijtsrd.com | Volume - 2 | Issue – 3 Modeling of Predictive interaction of Water Parameters in Groundwater Ottos C. G Isaac E. . O Department of Civil Engineering, Rivers State University, Nkpolu, Port Harcourt, Nigeria ABSTRACT Department of Civil Engineering, Rivers State University, Nkpolu, Port Harcourt, Nigeria Department of Mechanical Engineering, Rivers State Department of Mechanical Engineering, Rivers State University, Nkpolu, Port Harcourt, Nigeria University, Nkpolu, Port Harcourt, Nigeria processes also in which the decomposed animals, vegetable materials, weathering products of rocks and minerals and soil ingredients [1 Natural water are component of continuing cy moisture evaporated from the oceans and other water surfaces is in turn precipitated in the form of rain, snow and hail. Some of this precipitation returns to water surface and falls upon the land .Some component of the water falling upon the land is u by vegetation, some through streams and lakes to the oceans, and some percolates into the ground. Water supplies are developed by the interception of the surface run off or by the collection of water which has percolated into the ground [6 conditions related to rain fall, run are factors of great concern in the development and purification of water supplies. Investigation presented in this article is to study the interaction of turbidity, total suspended solids and total dissolved solids between Obite to Oboburu communities. 2. Materials and Method The assessment presented in this article is centred on investigating the interaction of turbidity, total suspended solids and total dissolved solids interaction within the water bearing aquifer of Obite to Oboburu communities of Ogba/ Egbema/ government area of Experimental and modeled turbidity, total suspended solids and total dissolved solids investigated are within recommended standard of World Health Organization revealing the reliability of model equation in predicting groundwater parameters distribution upon influence of time, recharge, flow rate. Keywords: Obite, Oboburu, groundwater, predictive, interaction 1. INTRODUCTION The assessment presented in this article is centred on investigating the interaction of turbidity, total suspended solids and total dissolved solids interaction within the water bearing aquifer of Obite to Oboburu communities of Ogba/ Egbema/ Ndoni local government area of Experimental and modeled turbidity, total suspended solids and total dissolved solids investigated are within recommended standard of World Health Organization revealing the reliability of model n in predicting groundwater parameters distribution upon influence of time, recharge, flow processes also in which the decomposed animals, vegetable materials, weathering products of rocks and minerals and soil ingredients [1-12]. Natural water are component of continuing cycle moisture evaporated from the oceans and other water surfaces is in turn precipitated in the form of rain, snow and hail. Some of this precipitation returns to water surface and falls upon the land .Some component of the water falling upon the land is used by vegetation, some through streams and lakes to the oceans, and some percolates into the ground. Water supplies are developed by the interception of the surface run off or by the collection of water which has percolated into the ground [6-12]. Hydrogical conditions related to rain fall, run-off, and percolation are factors of great concern in the development and purification of water supplies. Rivers Rivers State, State, Nigeria. Nigeria. Obite, Oboburu, groundwater, predictive, The quality of water obtained from rivers is generally not reliable, as it contains large amounts of salt, sand and a lot of suspend matter, the disposal of the untreated or treated sewage into the rivers is further liable to contaminate the river water. T must therefore, be properly analyzed and well treated before supplying to the public [3]. About 1500milion km3 of water in the hydrosphere, about 95% of it is sea water, 4% is frozen as snow in mountains and cold regions, and only 1%is available human activity. It is confined in groundwater, rivers, lakes, soil profile, atmosphere and biological system. The term pollution perhaps explained as the weakening in chemical, physical and biological properties of water as a result of mainly human activities. Water contamination can be natural caused by Hydrological contamination can be natural caused by Hydrological The quality of water obtained from rivers is generally not reliable, as it contains large amounts of salt, sand and a lot of suspend matter, the disposal of the untreated or treated sewage into the rivers is further liable to contaminate the river water. The river water must therefore, be properly analyzed and well treated before supplying to the public [3]. About 1500milion km3 of water in the hydrosphere, about 95% of it is sea water, 4% is frozen as snow in mountains and Investigation presented in this article is to study the interaction of turbidity, total suspended solids and total dissolved solids between Obite to Oboburu 2.1 2.1 Examination Sampling Sampling Collection Collection / / Experimental Experimental able human activity. f water were collected from groundwater of Obite and Oboburu at an interval of five weeks from Ogba/Egbema/Ndoni L.G.A., Rivers State and parameters examined were turbidity, total dissolved solids and total suspended solids using standard Samples of water were collected from groundwater of Obite and Oboburu at an interval of five weeks from Ogba/Egbema/Ndoni L.G.A., Rivers State and parameters examined were turbidity, total dissolved solids and total suspended solids using standard method of APHA 2130B, APHA 2510B and APHA 30B, APHA 2510B and APHA It is confined in groundwater, rivers, lakes, soil profile, atmosphere and biological system. The term pollution perhaps explained as the weakening in chemical, physical and biological properties of water tivities. Water @ IJTSRD | Available Online @ www.ijtsrd.com @ IJTSRD | Available Online @ www.ijtsrd.com | Volume – 2 | Issue – 3 | Mar-Apr 2018 Apr 2018 Page: 1091
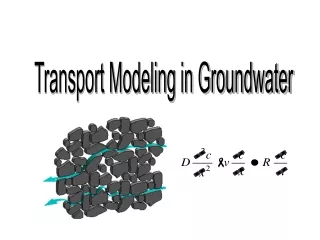
International Journal of Trend in Scientific Research and Development (IJTSRD) ISSN: 2456-6470 2510 B for turbidity, total dissolved solids and total suspended solids. Equation (1) is groundwater parameters distribution model for selected six well. 2.2 Simulation Model The flow rate at different nodes of consideration in Equation (1) is evaluated by using Equation (2) The model of groundwater parameters distribution below of Equation (1) will be used to simulate turbidity, total dissolved solids and total suspended solids interaction within the groundwater environment of the study area. Essential parameters in the distribution of groundwater parameters of interest as considered in this investigation were flow rate, recharge and hydraulic gradient and six well was used as recommended by Ukpaka, 2015. ? ??(?? ?) +? ?− ?? ? (? − 2?) (2) ? = For the purpose of evaluating flow rates in Equation (1), the hydraulic gradient of well 1, 2, 3, 4, 5 and 6 were determined, hydraulic conductivity (k) and a given recharge were considered. C Q Q Q Q Q Q C GQ 1 11 12 13 14 15 16 E 1 C Q Q Q Q Q Q C GQ 2 21 22 23 24 25 26 E 2 C Q Q Q Q Q Q C GQ 3 31 32 33 34 35 36 E 3 C C Q Q Q Q Q Q GQ 4 41 42 43 44 45 46 E 4 C Q Q Q Q Q Q C 51 52 53 54 55 56 E 5 GQ 5 Q Q Q Q Q Q C C E 6 61 62 63 64 65 66 GQ 6 3. Results and Discussion 2 Experimental Turbidity Values (mg/l) 1.8 1.6 1.4 Experimental Turbidity 1.2 1 Linear (Experimental Turbidity) T = -0.122w2+ 0.497w + 0.981 R² = 0.219, R=0.47 0.8 0.6 Poly. (Experimental Turbidity) 0.4 0.2 0 0 1 2 3 4 5 Time Values (Weeks) Figure 1: Graph of turbidity concentration versus time for polynomial and liner concept (Obite to Obuburu interaction). @ IJTSRD | Available Online @ www.ijtsrd.com | Volume – 2 | Issue – 3 | Mar-Apr 2018 Page: 1092
International Journal of Trend in Scientific Research and Development (IJTSRD) ISSN: 2456-6470 2 1.8 Theoretical Turbidity 1.6 Turbidity Values (mg/l) Experimental Turbidity 1.4 1.2 Modelled Turbidity 1 0.8 Linear (Theoretical Turbidity) 0.6 0.4 Linear (Experimental Turbidity) 0.2 0 Linear (Modelled Turbidity) 0 1 2 3 4 5 Time Values (Weeks) Figure 2: Graph of turbidity concentration versus time for the comparison of developed model data, theoretical and experimental data as well as linear polynomial of the curve (Obite to Obuburu interaction). Figure 1, it is seen that an increase in turbidity was experienced from zero to one week before sudden decrease from greater than one week to two weeks as well as increase from two weeks to three weeks before sudden decrease from week 3 to week 4. The polynomial equation of the best fit is given as T = -0.122w2 + 0.497w + 0.981 with R2 = 0.219. The experimental concentration of the turbidity was compared with the WHO standard and the result shows an acceptable limit, indicating the reliability of the experimental result as well as acceptability of he groundwater interaction of Obite to Obuburu. The variation in the turbidity concentration can be attributed to the variation in time. The result presented in Figure 2 illustrate the comparism of theoretical, experimental and developed model based on Darcy’s law shows a good match indicating reliability of the developed model to monitor and predict the groundwater interaction between Obite an Obuburu in Egi clan of Ogba/Egbema, Indoni local government area of Nigeria. The variation in the turbidity concentration can be attributed to the variation in time. The linear polynomial of the curve was establishment as presented in Figure 2. The research work based on Darcy’s law can be used in monitoring and predicting the ground water interaction using the concept of Matrix. 6 Experimental Total Suspended 5 Experimental Total Suspended Solids Solids Values (mg/l) 4 TSS = 0.198w2- 0.732w + 5.223 R² = 0.403, R=0.63 2 3 Linear (Experimental Total Suspended Solids) 1 Poly. (Experimental Total Suspended Solids) 0 0 2 4 6 Times Values (Weeks) Figure 3: Graph of total suspended solids (TSS) concentration versus time for polynomial and linear concept (Obite to Obuburu interaction). @ IJTSRD | Available Online @ www.ijtsrd.com | Volume – 2 | Issue – 3 | Mar-Apr 2018 Page: 1093
International Journal of Trend in Scientific Research and Development (IJTSRD) ISSN: 2456-6470 6 Total Suspended Solids Values (mg/l) Theoretical Total Suspended Solids 5 4 Experimental Total Suspended Solids 3 Modelled Total Suspended Solids 2 1 Linear (Theoretical Total Suspended Solids) 0 0 1 2 3 4 5 Times Values (Weeks) Figure 4: Graph of total suspended solid (TSS) concentration versus time for the comparison of developed model data, theoretical and experimental data as well as linear polynomial of the curve (Obite to Oboburu interaction). It is see that the total suspended solid (TSS) concentration of the ground water interaction between Obite and Oboburu decrease from zero week to one week before sudden increase in TSS concentration from greater than one week to four weeks as presented in Figure 3. The polynomial equation for the expression is given as TSS = 0.198w2 – 0.732w + 5.223 with R2 = 0.403. The variation on the total suspended solid can be attributed to the variation in time. The result obtained is within the acceptable limit of the World Health Organisation (WHO) standard. Figure 4 illustrate the comparison of experimental, theoretical and developed model based on Darcy’s law for Obite and Oboburu groundwater interaction. The variation in total suspended solid can be attributed to the variation in time as well as functional parameters. The results presented in Figure 4 shows a good match indicating the reliability of the developed model of Darcy’s law as well as the polynomial theoretical are found useful in monitoring and predicting he groundwater influence of total suspended solid. 19.6 Experimental Total Dissolved Solid 19.4 19.2 TDS = 0.104w2- 0.565w + 19.19 R² = 0.272, R=0.52 19 Values (mg/l) Experimental Total Dissolved Solids 18.8 18.6 Linear (Experimental Total Dissolved Solids) 18.4 Poly. (Experimental Total Dissolved Solids) 18.2 18 17.8 0 2 4 6 Time Values (Weeks) Figure 5: Graph of total dissolved solid (TDS) concentration versus time for polynomial and linear concept (Obite to Oboburu interaction). @ IJTSRD | Available Online @ www.ijtsrd.com | Volume – 2 | Issue – 3 | Mar-Apr 2018 Page: 1094
International Journal of Trend in Scientific Research and Development (IJTSRD) ISSN: 2456-6470 50 Total Dissolved Solids Values (mg/l) 45 Theoretical Total Dissolved Solids 40 Experimental Total Dissolved Solids 35 30 Modelled Total Dissolved Solids 25 20 Linear (Theoretical Total Dissolved Solids) 15 10 Linear (Experimental Total Dissolved Solids) 5 0 Linear (Modelled Total Dissolved Solids) 0 1 2 3 4 5 Time Values (Weeks) Figure 6: Graph of total dissolved solid (TDS) concentration versus time for the comparison of developed model data, theoretical and experimental data as well as linear polynomial of the curve (Obite to Oboburu interaction) 4. Conclusions The following conclusions are drawn from the investigation; 1.The following predictive models were produced for turbidity, total suspended solids and total dissolved solids as, = −0.122??+ 0.497? + 0.981 , ??? = 0.198??− 0.732? + 5.223 and ??? = 0.104??− 0.565? + 19.19 coefficients of determination 0.219,0.403 ??? 0.272 turbidity, total suspended solids and total dissolved solids. From Figure 5 it is seen that the concentration of total dissolved solid increase from zero well to one week before sudden decrease from one week to two weeks as well as increase from two weeks to four weeks as presented in Figure 4.13. The polynomial of expression is given by TDS = 0.104w2 – 0.565w + 19.19 with R2 = 0.272. The variation in the total dissolved solid can be attributed to the variation in time and other functional experimental result of the total dissolved solid was compared with the WHO standard and result show an acceptable limit indicating the reliability of the experimental results. with ??= for of been generated parameters. The 2.Experimental and modelled turbidity, total suspended solids and total dissolved solids within standard recommended Organisation that explained the reliability of the modelled equation in evaluating groundwater interaction. by World Health The result presented in Figure 6 indicate the comparison of the experimental, theoretical and developed model based on the Darcy’s law on the characteristics of total dissolved soli ground water interaction between Obite Ogba/Egbema/ Ndoni local government area of Nigeria. The results obtained indicate variation in time as well as functional parameters. The developed model results in this case shows a good match revealing the useful of the model to monitor and predict the total dissolved solid concentration upon the influence of time. 5. Reference 1)Ashely, R. P. and Misstear, B. D. (1990): Industrial development: the threat to groundwater quality, paper presented to illustration of water and Environmental Management, East Angelia Branch. and Oboburu in 2)Gajendran, C., Jayapriya, C., Diana Yohannan, Oshin Victor, Christiana Assessment of groundwater quality in Tirunevili District, Tamil Nadu, India, International journal Environmental Sciences, Vol. 3, no. 6, pp. 71 – 80. Jacob (2013): @ IJTSRD | Available Online @ www.ijtsrd.com | Volume – 2 | Issue – 3 | Mar-Apr 2018 Page: 1095
International Journal of Trend in Scientific Research and Development (IJTSRD) ISSN: 2456-6470 3)Garg, S. K. (2007): Hydrology and Water Resources Engineering, Edition, Khonna published, Dedhi, pp. 700 – 703. 9)Mensah, M. K. (2011): Assessment of drinking water quality in Ehi community in the Ketu – north District of the volta region of Ghana, pp 1 – 65. Fourteenth Revised 4)Gerard, K. (1998): Environmental Engineering, International Edition, McGraw – Hill, New York, PP. 200 – 929. 10)Ukpaka, C. P. and Chukwu J. (2012). “Investigating the physiochemical parameters and the portability of some rivers water in Rivers State of Nigeria”, journal of research in Environmental science toxicology, Vol. 7, pp. 168 – 185. 5)Hemant Pathak (2012): Evaluation of groundwater quality using multiple linear regression and mathematical equation modeling. Pp. 304 – 307. 11)Wild, A. and K.C. Cameron (1980): Nitrate leaching through soil considerations with special referenc to recent work in the United Kingdom soil Nitrogen Fertilizer or Pollutant. IAFA Publishers. Vienna, pp. 289-306. 6)Ify, L. Nwaogazie (1992): Rivers mass Transport Linear – Quadratic Element Model (RIMTRA), Environmental software, vol. 7, pp. 103 – 121. and environmental 7)Ify, L. Nwaogazie (2008): Finite Element Modeling of Engineering Systems with Emphasis in Water Resources, 2nd Edition, pp. 115 – 177. 12)Ukpaka, C. and Ezeilo, F. E. (2017). Comparative Evaluation of Groundwater Parameters Simulation by Method of Linear & Quadratic Shape Function. International Journal of Engineering, Volume 4, issue 10, pp.18-28. 8)Lawrence, A. (1990) ‘Groundwater Pollution threat from industrial Solvents’ NERC News, No. 13, pp.18 – 19. @ IJTSRD | Available Online @ www.ijtsrd.com | Volume – 2 | Issue – 3 | Mar-Apr 2018 Page: 1096