Download
1 / 6
60 likes | 76 Views
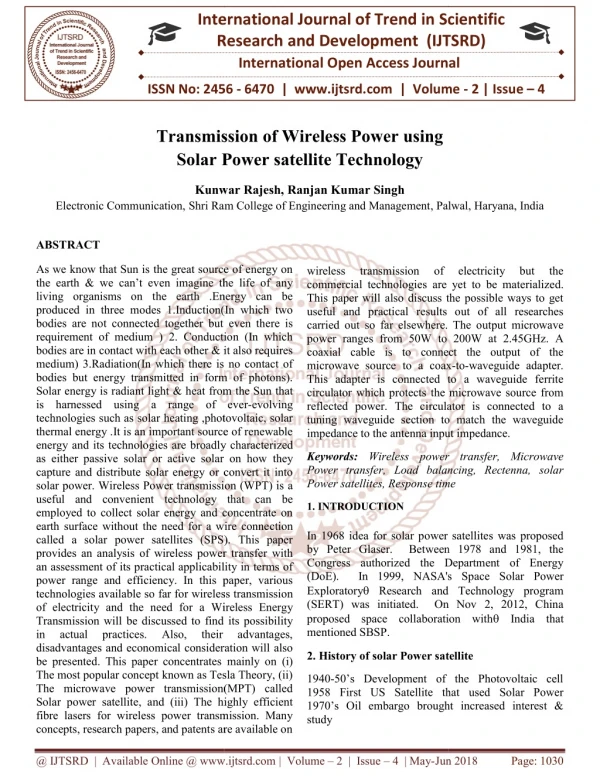
power transfer capability by analyzing and comparing several FACTS devices such as Static Var Compensator SVC , Static Synchronous Compensator STATCOM and Unified Power Flow Controller UPFC in long transmission line. These devices have been used in different locations such as sending end, middle and receiving end of transmission line. The suitable location and performance of each model has been analyzed. Firstly, real and reactive power profiles have been studied for uncompensated system and subsequent results are produced. Then these results are compared with the results obtained after compensating the system using afore mentioned FACTS devices. Overall analysis indicates that better power i.e. 87.24 power has been transferred when SVC is connected at the middle of the transmission line. All simulations have been done in MATLAB SIMULINK. K. Suneel Goutham | M. Bhaskar Rao | T. Jaganmohan Rao "Analysis of Power Transfer Capability of a Long Transmission Line Using FACTS Devices" Published in International Journal of Trend in Scientific Research and Development (ijtsrd), ISSN: 2456-6470, Volume-2 | Issue-4 , June 2018, URL: https://www.ijtsrd.com/papers/ijtsrd15615.pdf Paper URL: http://www.ijtsrd.com/engineering/electrical-engineering/15615/analysis-of-power-transfer-capability-of-a-long-transmission--line-using-facts-devices/k-suneel-goutham<br>

E N D
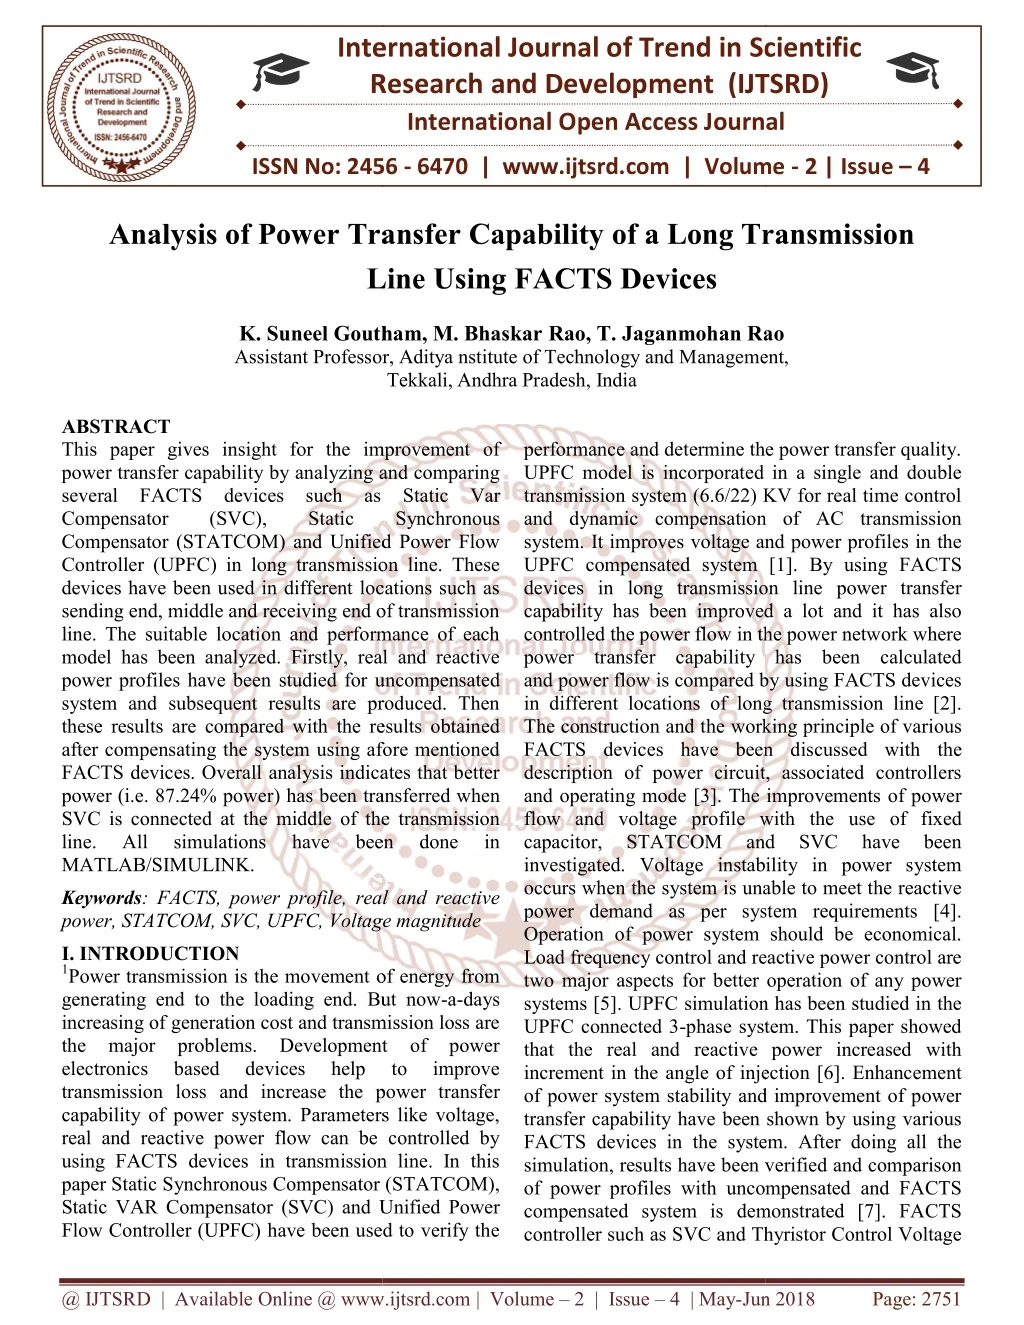
International Research Research and Development (IJTSRD) International Open Access Journal f Power Transfer Capability of a Long Transmission Line Using FACTS Devices K. Suneel Goutham, M. Bhaskar Rao, T. Jaganmohan Rao Professor, Aditya nstitute of Technology and Management, Tekkali,Andhra Pradesh, India International Journal of Trend in Scientific Scientific (IJTSRD) International Open Access Journal ISSN No: 2456 ISSN No: 2456 - 6470 | www.ijtsrd.com | Volume 6470 | www.ijtsrd.com | Volume - 2 | Issue – 4 Analysis of Power Transfer Capability Long Transmission Line K. Suneel Goutham, M. Bhaskar Assistant Professor Jaganmohan Rao anagement, ABSTRACT This paper gives insight for the improvement of power transfer capability by analyzing and comparing several FACTS devices such as Static Var Compensator (SVC), Compensator (STATCOM) and Unified Power Flow Controller (UPFC) in long transmission line. These devices have been used in different locations such as sending end, middle and receiving end of transmission line. The suitable location and performance of each model has been analyzed. Firstly, real and reactive power profiles have been studied for uncompensated system and subsequent results are produced. Then these results are compared with the results obtained after compensating the system using afore mentioned FACTS devices. Overall analysis indicates that better power (i.e. 87.24% power) has been transferred when SVC is connected at the middle of the transmission line. All simulations MATLAB/SIMULINK. Keywords: FACTS, power profile, real and reactive power, STATCOM, SVC, UPFC, Voltage magnitude I. INTRODUCTION 1Power transmission is the movement of energy from generating end to the loading end. But now increasing of generation cost and transmission loss are the major problems. Development of power electronics based devices transmission loss and increase the power transfer capability of power system. Parameters like voltage, real and reactive power flow can be controlled by using FACTS devices in transmission line. In this paper Static Synchronous Compensator (STATCOM), Static VAR Compensator (SVC) and Unified Power Flow Controller (UPFC) have been used to verify the Flow Controller (UPFC) have been used to verify the performance and determine the power transfer quality. UPFC model is incorporated in a single and double transmission system (6.6/22) KV for real time control and dynamic compensation of AC transmission system. It improves voltage and power profiles in the UPFC compensated system [1]. By using FACTS devices in long transmission line power transfer capability has been improved a lot and it has also controlled the power flow in the power network where power transfer capability has been calculated and power flow is compared by using FACTS devices in different locations of long transmission line [2]. The construction and the working principle of various FACTS devices have been d description of power circuit, associated controllers and operating mode [3]. The improvements of power flow and voltage profile with the use of fixed capacitor, STATCOM investigated. Voltage instability in power system occurs when the system is unable to meet the reactive power demand as per system requirements [4]. Operation of power system should be economical. Load frequency control and reactive power control are two major aspects for better operation of any power systems [5]. UPFC simulation has been studied in the UPFC connected 3-phase system. This paper showed that the real and reactive power increased with increment in the angle of injection [6]. Enhancement of power system stability and improvement of power transfer capability have been shown by using various FACTS devices in the system. After doing all the simulation, results have been verified and comparison of power profiles with uncompensated and FACTS compensated system is demonstrated [7]. FACTS controller such as SVC and Thyristor Control Voltage ch as SVC and Thyristor Control Voltage This paper gives insight for the improvement of power transfer capability by analyzing and comparing performance and determine the power transfer quality. UPFC model is incorporated in a single and double transmission system (6.6/22) KV for real time control compensation of AC transmission system. It improves voltage and power profiles in the UPFC compensated system [1]. By using FACTS devices in long transmission line power transfer capability has been improved a lot and it has also in the power network where power transfer capability has been calculated and power flow is compared by using FACTS devices in different locations of long transmission line [2]. The construction and the working principle of various FACTS devices have been discussed with the description of power circuit, associated controllers and operating mode [3]. The improvements of power flow and voltage profile with the use of fixed capacitor, STATCOM investigated. Voltage instability in power system ccurs when the system is unable to meet the reactive power demand as per system requirements [4]. Operation of power system should be economical. Load frequency control and reactive power control are two major aspects for better operation of any power ems [5]. UPFC simulation has been studied in the phase system. This paper showed that the real and reactive power increased with increment in the angle of injection [6]. Enhancement of power system stability and improvement of power er capability have been shown by using various FACTS devices in the system. After doing all the simulation, results have been verified and comparison of power profiles with uncompensated and FACTS compensated system is demonstrated [7]. FACTS as Static Var , Static Static Synchronous Synchronous Compensator (STATCOM) and Unified Power Flow mission line. These devices have been used in different locations such as sending end, middle and receiving end of transmission line. The suitable location and performance of each model has been analyzed. Firstly, real and reactive studied for uncompensated system and subsequent results are produced. Then these results are compared with the results obtained after compensating the system using afore mentioned FACTS devices. Overall analysis indicates that better wer) has been transferred when SVC is connected at the middle of the transmission line. All simulations have have been been done done in in and and SVC SVC have have been been FACTS, power profile, real and reactive power, STATCOM, SVC, UPFC, Voltage magnitude Power transmission is the movement of energy from generating end to the loading end. But now-a-days increasing of generation cost and transmission loss are the major problems. Development of power electronics based devices and increase the power transfer capability of power system. Parameters like voltage, real and reactive power flow can be controlled by using FACTS devices in transmission line. In this paper Static Synchronous Compensator (STATCOM), (SVC) and Unified Power help help to to improve improve @ IJTSRD | Available Online @ www.ijtsrd.com @ IJTSRD | Available Online @ www.ijtsrd.com | Volume – 2 | Issue – 4 | May-Jun 2018 Jun 2018 Page: 2751
International Journal of Trend in Scientific Research and Development (IJTSRD) ISSN: 2456-6470 it has DC link nominal voltage of 40 KV with an equivalent capacitance 375μF. The simulation results have been collected by changing the location of STATCOM i.e. sending end, middle and receiving end of the transmission line. Also the simulation results have been collected by changing the location of SVC and UPFC. Regulator are used at the load end to maintain the voltage profile by using SVC in parallel with the load where TCVR gives the series injection [8]. It is shown by M.Kowsalya et al. that the location where the FACTS devices are used to get higher benefits and control of reactive power [9]. D. Murali et al. demonstrated that active and reactive power flow control and improvement of transient stability can be done by using UPFC in both series and shunt parameters. The simulation results demonstrate the effectiveness and robustness of the proposed UPFC on transient stability improvement of the system [10]. Improvement of power system performance with VAR compensation have been shown here. Reactive power control has been observed by shunt and series capacitive arrangement [11]. Voltage dynamics and oscillations can be controlled by using shunt connected FACTS devices. Power transfer capability, stability and reliability of transmission systems could be further increased by using the inventive strategies incorporating system-wide control logic. Controllers would be able to maximize available transfer capacity which maintains dynamic stability and security [12]. Improvement of power transfer capacity, quality and reliability by using UPFC [13] and a comparative study of theperformances with other FACTS devices have been demonstrated. II. CIRCUIT DESCRIPTION The power grids consist of two equivalent sources of 500KV 3000MVAR each, connected with 700 km long transmission line. Three loads of 150MW each are connected. 1756.3 MW power has been transferred from bus B1 to B3. When the FACTS devices were not connected, the percentage of power flow capability was 79.72%. The circuit diagram of uncompensated system is given below: Fig. 1. Circuit diagram of uncompensated system The shunt FACTS device STATCOM has been added to the circuit which has rating of +/- 100 MVA. Also Fig. 2. Circuit diagram of STATCOM compensated system III. SIMULATION RESULTS AND DISCUSSION The real and reactive power flows of uncompensated system are tabulated bellow: TABLE 1 Power Flow B1 P(MW) 1756.3 Q(MVAR) 1292.7 B2 1728.0 1259.9 B3 1400.1 1129.6 Fig. 3. Real power of uncompensated system Fig.4. Reactive power of uncompensated system @ IJTSRD | Available Online @ www.ijtsrd.com | Volume – 2 | Issue – 4 | May-Jun 2018 Page: 2752
International Journal of Trend in Scientific Research and Development (IJ International Journal of Trend in Scientific Research and Development (IJTSRD) ISSN: 2456 TSRD) ISSN: 2456-6470 The above graphs (Fig 3 and Fig 4) show the real and reactive power flow of uncompensated system. It is seen that 79.72% power has been transferred from bus B1 to bus B3. The real and reactive power flows of STATCOM compensated system are tabulated bellow: TABLE 2 Position Power Flow Sending End Q(MVAR) 1241.5 1187.3 Middle P(MW) 1621.6 1609.0 Q(MVAR) 1351.9 1292.8 Receiving End Q(MVAR) 1308.0 1281.1 The above graphs (Fig 3 and Fig 4) show the real and reactive power flow of uncompensated system. It is seen that 79.72% power has been transferred from bus and reactive power flows of STATCOM compensated system are tabulated bellow: Fig. 7. Real power flow of STATCOM compensated system (Middle) Fig. 7. Real power flow of STATCOM compensated system (Middle) B1 B2 B3 P(MW) 1723.1 1707.7 1707.7 1389.0 1187.3 1064.0 1609.0 1405.1 1292.8 994.5 1651.4 1346.1 1281.1 1132.8 P(MW) 1682.2 1651.4 Fig. 8. Reactive power flow of STATCOM compensated system (Middle) compensated system (Middle) low of STATCOM The above graphs (Fig 7 and Fig 8) show the real and reactive power flow of SATCOM compensated system. It is seen that 86.65% power has been transferred from bus B1 to bus B3 when STATCOM is connected at middle of transmission line. f transmission line. The above graphs (Fig 7 and Fig 8) show the real and reactive power flow of SATCOM compensated system. It is seen that 86.65% power has been transferred from bus B1 to bus B3 when STATCOM Fig. 5. Real power flow of STATCOM compensated system (Sending End) Fig. 5. Real power flow of STATCOM compensated Fig. 9. Real power flow of STATCOM compensated system (Receiving End) Fig. 9. Real power flow of STATCOM compensated system (Receiving End) Fig. 6. Reactive power flow of STATCOM compensated system (Sending End) compensated system (Sending End) Fig. 6. Reactive power flow of STATCOM The above graphs (Fig 5 and Fig 6) show the real and reactive power flow of STATCOM compensated system. It is seen that 80.61% power has been transferred from bus B1 to bus B3 when STATCOM is connected at sending end of transmission line. The above graphs (Fig 5 and Fig 6) show the real and STATCOM compensated system. It is seen that 80.61% power has been transferred from bus B1 to bus B3 when STATCOM is connected at sending end of transmission line. Fig. 10. Reactive power flow of STATCOM Fig. 10. Reactive power flow of STATCOM compensated system (Receiving End) compensated system (Receiving End) The above graphs (Fig 9 and Fig 10) show the real and reactive power flow of STATCOM system. It is seen that 80.02% power has been transferred from bus B1 to bus B3 when STATCOM is connected at receiving end of transmission line. The above graphs (Fig 9 and Fig 10) show the real and reactive power flow of STATCOM compensated system. It is seen that 80.02% power has been transferred from bus B1 to bus B3 when STATCOM is connected at receiving end of transmission line. @ IJTSRD | Available Online @ www.ijtsrd.com @ IJTSRD | Available Online @ www.ijtsrd.com | Volume – 2 | Issue – 4 | May-Jun 2018 Jun 2018 Page: 2753
International Journal of Trend in Scientific Research and Development (IJTSRD) ISSN: 2456-6470 The real and reactive power flows of SVC compensated system are tabulated bellow: TABLE 3 Position Power Flow Sending End Q(MVAR) 1233.5 1175.6 Middle P(MW) 1611.5 1599.8 Q(MVAR) 1355.6 1295.2 Receiving End Q(MVAR) 1308.1 1281.6 B1 B2 B3 P(MW) 1717.6 1704.5 1387.4 1053.2 1405.9 985.3 1344.5 1133.1 Fig. 14. Reactive power flow of SVC compensated system (Middle) P(MW) 1680.4 1649.6 The above graphs (Fig 13 and Fig 14) show the real and reactive power flow with the change of simulation time at SVC compensated system. It is seen that 87.24% power has been transferred from bus B1 to bus B3 when SVC is connected at middle of transmission line. Fig. 11. Real power flow of SVC compensated system (Sending End) Fig. 15. Real power flow of SVC compensated system (Receiving End). Fig. 12. Reactive power flow of SVC compensated system (Sending End) The above graphs (Fig 11 and Fig 12) show the real and reactive power flow of SVC compensated system. It is seenthat 80.78% power has been transferred from bus B1 to bus B3 when SVC is connected at sending end of transmission line. Fig. 16. Reactive power flow of SVC compensated system (Receiving End) The above graphs (Fig 15 and Fig 16) show the real and reactive power flow of SVC compensated system. It is seen that 80.01% power has been transferred from bus B1 to bus B3 when SVC is connected at receiving end of transmission line. The real and reactive power flows of SVC compensated system are tabulated bellow: Fig. 13. Real power flow of SVC compensated system (Middle) @ IJTSRD | Available Online @ www.ijtsrd.com | Volume – 2 | Issue – 4 | May-Jun 2018 Page: 2754
International Journal of Trend in Scientific Research and Development (IJ International Journal of Trend in Scientific Research and Development (IJTSRD) ISSN: 2456 TSRD) ISSN: 2456-6470 TABLE 4 Power Flow P(MW) Q(MVAR) 1241.2 P(MW) Q(MVAR) 1352.2 P(MW) Q(MVAR) 1308.2 Position B1 B2 B2 B3 Sending End Middle 1723.1 1707.6 1187.1 1609.5 1292.7 1651.8 1281.0 1281.0 1707.6 1187.1 1609.5 1292.7 1651.8 1388.8 1064.0 1404.7 994.3 1346.4 1132.7 1621.8 Receiving End 1682.3 Fig. 20. Reactive power flow of Fig. 20. Reactive power flow of UPFC compensated system (Middle) system (Middle) The above graphs (Fig 19 and Fig 20) show the real and reactive power flow of UPFC compensated system. It is seen that 86.61% power has been transferred from bus B1 to bus B3 when UPFC is connected at middle of transmissio The above graphs (Fig 19 and Fig 20) show the real and reactive power flow of UPFC compensated system. It is seen that 86.61% power has been transferred from bus B1 to bus B3 when UPFC is connected at middle of transmission line. Fig. 17. Real power flow of UPFC compensated system (Sending End) Fig. 17. Real power flow of UPFC compensated Fig. 21. Real power flow of UPFC compensated system (Receiving End) Fig. 21. Real power flow of UPFC compensated system (Receiving End) Fig. 18. Reactive power flow of UPFC compensated system (Sending End) The above graphs (Fig 17 and Fig 18) show the real and reactive power flow of UPFC compensated system. It is seen that 80.60% power has been transferred from bus B1 to bus B3 when UPFC is connected at sending end of transmission line. Fig. 18. Reactive power flow of UPFC compensated The above graphs (Fig 17 and Fig 18) show the real FC compensated system. It is seen that 80.60% power has been transferred from bus B1 to bus B3 when UPFC is connected at sending end of transmission line. Fig. 22. Reactive power flow of UPFC compensated Fig. 22. Reactive power flow of UPFC compensated system (Receiving End) system (Receiving End) The above graphs (Fig 21 and Fig 22) show the real and reactive power flow of UPFC compensated system. It is seen that 80.03% power has been transferred from bus B1 to bus B3 when UPFC is connected at receiving end of transmission line. The above graphs (Fig 21 and Fig 22) show the real and reactive power flow of UPFC compensated . It is seen that 80.03% power has been transferred from bus B1 to bus B3 when UPFC is connected at receiving end of transmission line. Fig. 19. Real power flow of UPFC compensated system (Middle) 19. Real power flow of UPFC compensated @ IJTSRD | Available Online @ www.ijtsrd.com @ IJTSRD | Available Online @ www.ijtsrd.com | Volume – 2 | Issue – 4 | May-Jun 2018 Jun 2018 Page: 2755
International Journal of Trend in Scientific Research and Development (IJTSRD) ISSN: 2456-6470 IV. COMPARISON OF POWER TRANSFER CAPABILITY TABLE 2 Position STATCOM Sending End Sending End Receiving End ACKNOWLEDGMENT My heartiest respect is extended towards my guides and all other faculty members for their valuable guidance, suggestion and inspiration to carry out this work in a proficient manner. REFERENCES 1.Ch. Chengaiah, R.V.S. Satyanarayana, “Power flow assesment in transmission lines simulink model with International Conference Electronics and Electrical [ICCEET]. SVC 80.78% UPFC 80.60% 80.61% 86.65% 87.24% 86.61% using 2012 upfc”, 80.02% 80.01% 80.03% on Computing, Technologies 2.M. Karthikeyan, P. Ajay-d-Vimalraj, “Analysis and comparison of power flow and power transfer capability in a long transmision line using shunt facts devices”, European Journal of Scientific Research, Vol.73 No.2 (2012), pp. 210-220 3.K. R. Padiyar, “FACTS controllers in power transmission and distribution,” New Age Int. Publisher, 2007. Fig. 23. Comparison of power transfer capability between uncompensated and FACTS compensated system 4.Anulekha Saha, Kumar Chakraborty, “Performance analysis and comparison of various FACTS devices in power system”. International Journal of Computer Applications (0975-0887) Volime 46- No.15. May 2012. Priyanath Das, Ajoy V. CONCLUSION The power flow and the power transfer capability are the essential attributes which are to be controlled and increased by using the FACTS devices for long transmission line. In this paper FACTS devices such as STATCOM, SVC and UPFC were connected in various locations i.e. sending end, middle and receiving end of the long transmission line. The results have been obtained in both compensated and uncompensated system. By observing all the results it is concluded that if FACTS devices are used in the middle of the long transmission line then the power flow result will be better than uncompensated system. From the above results it is also seen that 87.24% power has been transferred when SVC is connected at the middle of the transmission line. 5.Dr. B. R. Gupta & Er. Vandana Singhal, “Power system operation and control”, S. Chand Publications. 6.Parvej Khan, Himmat Singh , “Power flow control in a transmission line through upfc”, International Journal of Emerging Technology and Advanced Engineering, Volume 2, Issue 12, December 2012. 7.Samima Akter, Anulekha Saha, Prof. Priyanath Das , “Modeling, simulation and comparison of various facts devices in International Journal Technology (IJERT), Vol. 1 Issue 8, October- 2012. power system”, Engineering of & @ IJTSRD | Available Online @ www.ijtsrd.com | Volume – 2 | Issue – 4 | May-Jun 2018 Page: 2756