Download
1 / 6
60 likes | 62 Views
This study concentrates on empirical assessment of Capital Asset Pricing Model CAPM on the National Stock Exchange NSE . CAPM assists to determine a well diversified portfolio. The main objective of this research paper is to check the applicability of Nobel laureates model in Indian equity market by testing the relationship between risk and return, whether there is any direct proportionality in the expected rate of return and its systematic risk. It relates its results by using the beta systematic risk as a measuring factor. The study was being conducted for a period of 260 weeks from 7 April 2013 to 25 March 2018. 45 companies from NSE were picked as a proxy for the market portfolio. This research was done by using regression analysis on stocks and portfolio to find out the final results. Research of this study nullifies that this model is applicable to the Indian market and also contradicts its expected return and systematic risk which are linearly related to each other. Miss. Yashashri Shinde | Miss. Teja Mane "An Empirical Assessment of Capital Asset Pricing Model with Reference to National Stock Exchange" Published in International Journal of Trend in Scientific Research and Development (ijtsrd), ISSN: 2456-6470, Special Issue | Fostering Innovation, Integration and Inclusion Through Interdisciplinary Practices in Management , March 2019, URL: https://www.ijtsrd.com/papers/ijtsrd23105.pdf Paper URL: https://www.ijtsrd.com/management/public-sector-management/23105/an-empirical-assessment-of-capital-asset-pricing-model-with-reference-to-national-stock-exchange/miss-yashashri-shinde<br>

E N D
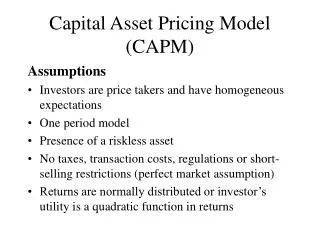
International Journal of Trend in Scientific Research and Development (IJTSRD) Conference Issue | March 2019 Available Online: www.ijtsrd.com e-ISSN: 2456 - 6470 Fostering Innovation, Integration and Inclusion Through Interdisciplinary Practices in Management An Empirical Assessment of Capital Asset Pricing Model with Reference to National Stock Exchange Miss. Yashashri Shinde, Miss. Teja Mane Student, Department of management Chhatrapati Shahu Institute of Business Education and Research, Shivaji University Kolhapur,Maharashtra, India Organised By: Management Department, Chhatrapati Shahu Institute of Business Education and Research, Kolhapur, Maharashtra well-diversified portfolio. The main objective of this research paper is to check the applicability of Nobel laureate’s model in Indian equity market by testing the relationship between risk and return, whether there is any direct proportionality in the expected rate of return and its systematic risk. It relates its results by using the beta (systematic risk) as a measuring factor. The study was being conducted for a period of 260 weeks from 7 April 2013 to 25 March 2018. 45 companies from NSE were picked as a proxy for the market portfolio. This research was done by using regression analysis on stocks and portfolio to find out the final results. Research of this study nullifies that this model is applicable to the Indian market and also contradicts its expected return and systematic risk which are linearly related to each other. KEYWORDS: CAPM, Systematic risk, unsystematic risk 1. INTRODUCTION Investor’s main objective is to capitalize their invested amount in future by investing money in equity market. It is that component of market which boosts economic system of a country and generates Diversification strategy of portfolio was proposed by harry Markowitz further whose theory is getting recognized as Capital Asset Pricing Model, this theory helps to explain how diversification reduces risk and increases return. Any spry investor knows the importance of diversification. In 1950 Markowitz was the first person to show quantitatively why and how diversification reduces risk he had got awarded for his work further his work was IJTSRD23105 ABSTRACT This study concentrates on empirical assessment of Capital Asset Pricing Model (CAPM) on the National Stock Exchange (NSE). CAPM assists to determine a How to cite this paper: Miss. Yashashri Shinde | Miss. Teja Mane “An Empirical Assessment of Capital Asset Pricing Model with Reference to National Stock Exchange” Published in International Journal of Trend in Scientific Research and Development (ijtsrd), ISSN: 2456- 6470, Special Issue Innovation, Integration and Inclusion Through Interdisciplinary Practices in Management, March 2019, pp.212-217, URL: https://www.ijtsrd. com/papers/ijtsrd2 3105.pdf He asked the follow up question- if rational investor follows the Markowitzian approach what is relationship between risk and return(Chandra, 2008) and he developed model called as Capital Asset Pricing Model predicting the relationship between risk of an asset and expected return. Its ability to produce standard for investments and its ability to predict return in advance what you likely to have as your return. There are multitude models which help to assess in which manner one should value the security. As per this model beta (systematic risk) is measure to influence on expected return. Higher the beta higher the returns. The CAPM will allow you to determine the required rate of return for any risky asset (Reilly & Brown, 2012).There are two types of risks are associated with any security they are systematic risk and unsystematic risk. Systematic risk emerges due to various reasons of market conditions which are unable to abolish through diversification also such as | Fostering being carried out by the William Sharpe. recession, while unsystematic risk is specific risk that can be diversifiable, which generally arises from the company in which you have invested. 1. LITURATURE REVIEW- (Fama & Mac Beth, J. D, 1973)This study is concerned with New York Stock Exchange predicting the relation between average risk and return. According to this CAPM indicates positive relation between risk and return and indicates linear relationship between them. (Andor, 1999)This study of CAPM is concerned with Hungarian Capital Market. For the purpose of this study data from 31st July 1991 to1st June 1999 was taken.17 Companies monthly data was used, these companies where listed on Budapest Stock Exchange (BSE). Relation between company’s beta and average returns was measured by @ IJTSRD | Unique Paper ID - IJTSRD23105 | Conference Issue | FIIITIPM - 2019 | March 2019 Page: 212
International Journal of Trend in Scientific Research and Development (IJTSRD) @ www.ijtsrd.com eISSN: 2456-6470 regression analysis. This shows the positive conclusion of Hungarian Capital Market. (Rahman, Baten, & Ashraf-Ul- Ala, 2006)This study was conducted in Bangladesh. It was checked whether CAPM is good indicator in Bangladesh. This study was done for the period of 1999-2003. This study of CAPM showed support to CAPM. Five variable stock returns, market size, sales were used to do study of CAPM and it has shown significant relation with stock return. (Chan, Hamao, &Lakonishok, 1991)The study assesses the relationship between returns on Japanese stocks from 1971 to 1988 to four variables, they are earnings yield, size, book to market ratio, and cash flow yield. The sample includes both manufacturing and nonmanufacturing firms, companies from both the Tokyo Stock Exchange and also delisted securities. The findings reveal a significant relationship between these variables and the expected returns in the Japanese market. Out of the four variables considered, the book to market ratio and cash flow yield have the most significant positive impact on expected returns. Study was conducted with reference to Tokyo stock exchange, studies the relation between returns for the period of 1971 to1988. As per this there is a significant relation between variables. Their size, cash flow, yields have considered to find out its validity. Shikha Mittal Shriwastav(January 2017), CAPM: This research has done to analyze the (Dhananjay, 2019)validity of CAPM by studying the relation between expected return and risk. Whether there is any linear relation between them and this is examined by studying returns of 15 company which were listed on National Stock Exchange. Period of five years had considered from January 2006 to December 2010. Findings have depicted that CAPM Doesn’t hold Indian equity market. Two methods were adopted to study its validity i.e cross sectional and portfolio analysis. CAPM is not supportive to Indian market. Jagannathan, Ravi &Zhenyu Wang (1993) “The CAPM is alive and well”, according to this empirical studies of the CAPM, it is commonly assumed that, (a) The return to the value- weighted portfolio of all stocks is a reasonable proxy for the return on the market portfolio of all assets in the economy, and (b) Betas of assets remain constant over time. Under these assumptions, they argue that these two auxiliary assumptions are not reasonable. We demonstrate maining 5 have neglected due to improper availability of data, that when these assumptions are relaxed, the empirical support for the CAPM is very strong. When human capital is also included in measuring wealth, the CAPM is able to explain 28% of the cross sectional variation in average returns in the 100 portfolio studied by Fama and French. When, in addition, betas are allowed to vary over the business cycle, the CAPM is able to explain 57%. More important, relative size does not explain what is left unexplained after taking sampling errors into account Dr. Chavan Pravin & Dr. Patil Dhananjay (Feb,2019) The Present study is an Empirical analysis of CAPM in Indian stock market with reference to S & P BSE Sensex for the period Jan 2011 to 2015. The CAPM Model Based on expected rate of return on an asset is directly proportional to its Beta with the Market Return. So, this study test the hypothesis the beta is the only factor that determine the return from the asset and asset return linearly related to the betas of the assets and the only risk that influence the return is the systematic risk is not established. The concluded that CAPM propositions do not hold true in Indian stock market, specifically for S&P BSE Sensex Indexed stock for the specified period. 2. OBJECTIVE Primary objective of this research is to explore whether the Capital Asset Pricing Model is applicable in Indian stock Market with reference to National Stock Exchange. Sub Objectives are: A.Whether risk of the security is dependent to their expected return. B.Whether there is any linear relationship between systematic risk of security and expected return. 3. RESEARCH METHODOLOGY Data- The details of this study collected from various sources has discussed below. Data for the period of 260 weeks, from 7 April 2013 to 25 March 2018.45 companies listed on NSE has been considered study, rehose companies whose data is complete that only has taken into consideration. Return from these companies has taken as returns of individual security. For market proxy returns of Nifty 50 has been considered the data has collected from different sources such as a investopedia.com. Treasury bills for 91 days is taken as a risk free return proxy. This study is conducted to check its applicability in Indian Market and it pertains to the Nifty50. Methodology adopted is as follow- Many financial industries, investors, professionals and analysts takes into consideration the time value of money, for that reason they use CAPM before taking an additional investment risk. In order to do study of this model following steps has been used. Variables such as a weekly returns of individual security, market returns and risk free returns have been used to make more transparency in study, for the purpose of research first step was to calculate beta. In this first stage of regression, beta of each security(45 companies) is calculated by regressing the return of security on the return of the market, before regressing this equation, return of 45 companies were calculated by using [(Today’s price/yesterday’s price- 1)*100] this formula, After calculating these individual return next was to calculate returns for NSE as a market proxy and also calculated bonds for the same period (risk free return), Returns of 91 days T-bill was used for the calculation of individual beta of the security. This risk free rate is used to calculate individual risk free stock return and risk free market return. For beta calculation, individual Risk free stock returns are regressed on risk free market return by using regression equation which is given below. SPSS software was used for running the regression analysis and to get the Beta values. These individual betas are useful to know volatility of stock. Beta estimation was done by using following equation, − = + ( − ) + (1) @ IJTSRD | Unique Paper ID - IJTSRD23105 | Conference Issue | FIIITIPM - 2019 | March 2019 Page: 213
International Journal of Trend in Scientific Research and Development (IJTSRD) @ www.ijtsrd.com eISSN: 2456-6470 Where, R itis the return on stock i (i=1…45), Rf is the rate of return on a risk-free asset, Rmtis the rate of return on the market index, Βiis the estimate of beta for the stock i , and eit is the corresponding random disturbance term in the regression equation This calculated beta has been used to form portfolio. It was arranged according to highest beta order to reduce the risk of diversification. From these beta values 5 portfolios have prepared including 9 companies in each portfolio. Next was to calculate portfolio beta, for that by taking their average, excess portfolio returns were calculated. To estimate the beta value of portfolio, risk free portfolio returns have regressed against excess return on market portfolio. Following equation was used to estimate portfolio beta, = + .+ Where, Rpt is the average portfolio excess returns of stocks Rp is the average excess return on a portfolio, Βp is an estimate of beta of the portfolio, γ1 is the market price of risk, the risk premium for bearing one unit of beta risk, γ0 is the zero-beta rate, the expected return on an asset which has a beta of zero, ep is random disturbance term in the regression equation. 4. HYPOTHESIS The hypothesis proposed for the study are- By following the above steps similarity of hypothesis CAPM were tested. For CAPM to be true it must satisfy following hypothesis. Y0 = 0, is expected to be zero. Zero beta portfolio. Y1 > 0, returns should be positive for risk taken by the investor. 5. DATA ANALYSIS: This section deals with the results of above steps. In first equation, regression on risk free market returns against individual risk free returns was resulted in the form of beta value of individual security. Table no.1 shows the results of first stage that the R value represents the simple correlation between risk free return of the individual security (dependent variable) and risk free market return (independent variable). Here R values for security are nearly 0, 0.1, 0.2, and 0.3 for all securities. It indicates there are not strong correlations between the variables. The R2 value (the "R Square" column) indicates how much of the total variation in the risk free return of the security (dependent variable), Price, can be explained by the risk free market return (independent variable), Income. For Example Tata Motors, R square value is 0.001 means only 0.1 percent variation in dependent variable is measured by independent variable. Similarly for ICICI Bank R Square value is 0 means zero percent variation in dependent variable is measured by independent variable and so on. βp is the Beta values of portfolio ept is random disturbance term in the regression equation. By this equation we got beta values for the portfolio and that used for further analysis. For that next regression was done to have final results. As per this model there is a linear relationship between systematic risk and return of an asset i.e. there is a relation between beta of an asset and return of the same. But it is converse of it, it was assessed that there isn’t linear relationship. Third regression equation is as follows, = ++ Where, Table no.1Average excess returns of the individual security and Beta for weekly returns of each stock. COMPANIES R R Square F TATA MOTARS 0 0.001 0.382 ICICI BANK 0 0 0.105 HERO MOTO CORP 0.3 0.001 0.238 SBI 0 0.002 0.403 ONGC 0.1 0.004 0.949 HDFC CORPORATION 0.1 0.008 2.055 BHARAT PETROLEUM 0.1 0.007 1.719 M&M 0.1 0.012 3.02 ZEEL 0.1 0.12 3.01 TATA STEEL 0.1 0.006 1.476 GAIL 0.9 0.008 2.194 ULTRATAACH CEMENT 0.1 0.011 2.749 UPL 0.1 0.008 2.17 ITC 0.1 0.019 5.112 LARSEN & TURBO 0.1 0.012 3.07 BHARATI AIRTEL 0.1 0.016 4.091 RELIANCE 0.1 0.18 4.639 F sig Constant (Rm-Rf) 0.54 0.266 0.75 0.48 0.63 0.529 0.53 0.44 0.33 0.194 0.15 0.507 0.19 0.843 0.08 0.41 0.08 0.567 0.23 0.526 0.14 0.489 0.1 0.474 0.14 0.934 0.03 0.304 0.08 0.521 0.04 0.337 0.03 0.508 T Sig 0.54 -0.071 0.041 0.044 0.086 0.109 0.138 0.154 0.158 0.159 0.16 0.164 0.168 0.179 0.196 0.199 0.203 0.205 -0.62 0.324 0.75 0.488 0.63 0.635 0.53 0.974 0.33 1.433 0.15 1.311 0.19 1.738 0.08 1.735 0.08 1.215 0.23 1.481 0.14 1.658 1.473 0.14 2.261 0.03 1.752 0.08 2.023 0.44 2.154 0.32 0.1 @ IJTSRD | Unique Paper ID - IJTSRD23105 | Conference Issue | FIIITIPM - 2019 | March 2019 Page: 214
International Journal of Trend in Scientific Research and Development (IJTSRD) @ www.ijtsrd.com eISSN: 2456-6470 AXIS BANK 0.1 0.1 2.665 0.1 0.55 0.207 1.632 0.1 HINDUSTAN 0.1 0.008 2.042 0.15 1.251 .0209 1.429 0.15 PETROLEUM INDIAN OIL 0.1 0.013 3.508 0.06 0.787 0.217 1.873 0.06 TITAN 0.1 0.019 4.866 0.03 0.717 0.229 2.206 0.03 EITHER MOTAR 0.1 0.016 4.138 0.43 1.133 0.242 2.034 0.43 GRASIM INDUSTRIES 0.2 0.024 6.329 0.01 0.583 0.249 2.516 0.01 GRASIM INDUSTRIES 0.2 0.024 6.329 0.01 0.583 0.249 2.516 0.01 KOTAK BANK 0.2 0.26 6.81 0.01 0.62 0.249 2.61 0.01 YES BANK 0.1 0.01 2.733 0.1 0.865 0.25 1.653 0.1 HINDUSTAN UNILIVER 0.2 0.035 9.271 0 0.601 0.274 3.045 0 SUN PHARMA 0.2 0.027 7.1 0.01 0.262 0.286 2.665 0.01 TCS 0.2 0.046 12.35 0 0.475 0.29 3.515 0 INFOSYS 0.2 0.042 11.27 0 0.447 0.295 3.357 0 MARUTI SUZUKI 0.2 0.034 9.143 0 0.895 0.299 3.024 0 INDUSIND BANK 0.2 0.029 7.701 0.01 0.77 0.3 2.775 0.01 ASIAN PAINTS 0.2 0.043 11.47 0 0.543 0.31 3.386 0 CIPLA 0.2 0.44 11.83 0 0.314 0.314 3.439 0 HCL TECH 0.2 0.049 13.38 0 0.586 0.323 3.658 0 TECH MAHINDRA 0.2 0.042 11.39 0 0.609 0.323 3.374 0 POWERGRID CORP 0.2 0.052 14.06 0 0.434 0.326 3.749 0 NTPC 0.2 0.04 10.79 0 0.308 0.327 3.285 0 HDFC BANK 0.3 0.061 16.89 0 0.589 0.332 4.109 0 0.2 BAJAJ FINANCE 0.027 7.25 0.01 1.376 0.334 2.693 0.01 0 0 0 0 0 0 BAJAJ FINSERVE 0.2 0.044 11.74 0 0.95 0.372 3.426 COAL INDIA DR. RODDY’S LAB INFRATEL WIPRO LUPIN 0.2 0.2 0.2 0.3 0.3 0.05 0.54 0.057 0.09 0.069 13.72 14.59 15.64 25.58 19.09 0 0 0 0 0 0.323 262 0.504 0.33 0.292 0.403 0.408 0.419 0.442 0.453 3.704 3.82 3.954 5.058 4.369 Table no. 2 indicates that average excess returns of portfolio and portfolio beta of a security. Portfolio R R2 F F sig P1 0.558 0.311 116.460 0.000 P2 0.525a 0.276 98.150 0.000b P3 0.475a 0.226 75.126 0.000b P4 0.426a 0.182 57.249 0.000b P5 0.423a 0.179 56.151 0.000b Β T Constant Intercept 0.194 0.268 0.426 0.331 0.413 Sig -1.58 -10.792 0.000 -1.55 -9.907 -1.33 -8.668 -1.14 -7.566 -1.19 -7.493 0.000 0.000 0.000 0.000 @ IJTSRD | Unique Paper ID - IJTSRD23105 | Conference Issue | FIIITIPM - 2019 | March 2019 Page: 215
International Journal of Trend in Scientific Research and Development (IJTSRD) @ www.ijtsrd.com eISSN: 2456-6470 Above table indicates that, the beta coefficients of portfolios are significant at 1 percent level. Besides intercept term of the portfolio is significant for all the portfolios. In case of capital asset pricing model beta must be positive but here it is negative. Also it indicates that the R value represents the simple correlation between risk free return of the portfolio (dependent variable)and risk free market return (independent variable). Here R values for portfolio are 0.558, 0.525, 0.475, 0.426 and 0.426 for p1,p2, p3,p4 and p5 respectively. It indicates there are not strong correlations between the variables. The R2 value (the "R Square" column) indicates how much of the total variation in the risk free return of the portfolio (dependent variable), Price, can be explained by the risk free market return (independent variable), Income. For portfolio P1, R square value is 0.31 means only 31 percent variation in dependent variable is measured by independent variable. Similarly for p2 R Square value is 0.27 means 27 percent variation in dependent variable is measured by independent variable and so on. Table no.3 is the result of third regression equation by using values of above table, regression on the portfolio returns against the portfolio betas obtained by Equation 3. Table no.3 Excess portfolio returns and beta values of portfolio Portfolio Average returns Beta values P1 0.53 P2 0.59 P3 0.71 P4 0.57 P5 0.66 Test of beta: Table no.4 Results of Portfolio average returns regressed on Portfolio beta. ANOVAa Sum of Squares Regression Residual Total a. Dependent Variable: beta b. Predictors: (Constant), port The ANOVA table shows F value 0.685 and the p-value is 0.469. It is greater than 0.05 % (p>0.05). It is significantly different from the 0.05level. The model is not significant. It is inferred that the CAPM model is not applicable to Indian stock market, specifically to NSE Nifty based companies. Another important hypothesis of CAPM is that the assets returns are linearly related to the betas of the assets. This means that the term like Beta square if substituted for beta should not yield better explanatory power. Table no. 5 Regression result of beta test Coefficientsa Model Unstandardized Coefficients Standardized Coefficients B Std. Error 1 (Constant) .901 Port 1.462 a. Dependent Variable: beta If the CAPM is true, γ0should be equal to zero, Here Y0 is -2.100 means it is not zero. Hence it is concluded that CAPM is not applicable in Indian NSE Market. If this Capital Asset Pricing model is really true, then it should be applicable to Indian market i.e. γ0 should be equal to zero 6. CONCLUSION In this research applicability of CAPM was tested in Indian stock market with reference to NSE for 260 weeks of 5 years from 7 April 2013 to 25 March 2018. The results contravent the CAPM hypothesis that portfolio returns are determined by the beta. As per hypothesis risk is the only factor to impact on returns of security and there is linear relationship between risk and return. Empirical study has proven that CAPM in India does not hold true especially for NSE during that period. Incompetence of CAPM makes it unable to predict the market behavior, hence one should explore the parameters before investment in stocks, also can study another models of stock market -1.58 -1.55 -1.33 -1.14 -1.19 Model Df Mean Square F Sig. .030 .132 .162 1 3 4 .030 .044 .685 .469b 1 T Sig. Beta .431 -2.330 .102 .828 .469 @ IJTSRD | Unique Paper ID - IJTSRD23105 | Conference Issue | FIIITIPM - 2019 | March 2019 Page: 216
International Journal of Trend in Scientific Research and Development (IJTSRD) @ www.ijtsrd.com eISSN: 2456-6470 REFERENCES [1]Andor, G. (1999). Empirical Test of Capital Asset Pricing Model in Hungarian Capital Market. Perodica Polytechnica ser, Soc. Man. sci 7, 47-61. [2]Andor, G. (2010). Empirical Tests of capital Asset Pricing Model (CAPM) in the Hungarian Capital Market. Perodica Polytechnica ser. soc. man, sci., 209-220. [3]Bajpei, S. (n. d.). An Empirical Testing of Capital Asset Pricing Model in India. [4]Basu, D. &. (2010). Empirical Test of CAPM- The case of Indian Stock Market. Global Business Review, 209-220. [5]R. Kothari, G. G. (2011). Research Methodology: Method and Techniques. New Delhi : New Age International Publishers. [6]Chandra, P. (2008). Investment Analysis and Portfolio Management. New Delhi: Tata McGraw Hill. [7]Chaudhary, P. (2016). Testing Of CAPM in Indian Context. Business Analyst, 1-18. [8]Choudhary, K. a. (2010). Testing Capital Asset Pricing Model: Empircal evidance from Indian equity Market . Eurasian Journal of Business and Economics, 127-138. [9]Dhananjay, D. C. (2019). An Empirical test of CAPM with referance to S&P Research Review International multidisciplinary, 52-58. [10]Fama, E., & MacBeth, J. D. (1973). Risk ,return and equillibrium: empirical tests. political economy, 607- 636. [11]Hagin, R. L. (2004). Investment Management, Portfolio Diversification. Risk, And Timing-Fact and Fiction. [12]Reilly, F. K. (2012). Investment Analysis & Portfolio Management . South Western: Cengage learning . [13]Shriwastav, S. (2017). CAPM: Empirical Evidance from India. International Journal of core Engineering& Management, 3(10). Copyright © 2019 by author(s) and International Journal of Trend in Scientific Research and Development Journal. This is an Open Access article distributed under the terms of the Creative Commons Attribution License (CC BY 4.0) (http://creativecommons.org/licenses/by/4.0) BSE Sensex Journal Index. of @ IJTSRD | Unique Paper ID - IJTSRD23105 | Conference Issue | FIIITIPM - 2019 | March 2019 Page: 217