Download
1 / 6
60 likes | 76 Views
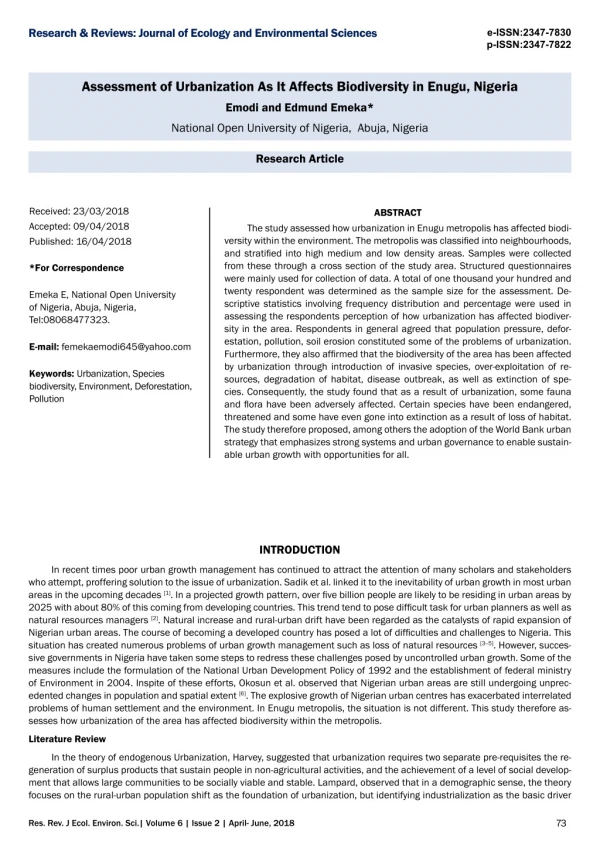
The application of suitable water quantity to the crops in irrigation farming is very important for effective crop yields as less or more than the required quantity of water when applied will affect the crop output negatively. The objective of this work was to determine the monthly reference Evapotranspiration of Nsukka, Enugu state of Nigeria, as well as how its variation is affected by temperature change. This work made use of Hargreaves Samani model of evapotranspiration prediction, using the data of minimum and maximum temperature obtained from NASA's earthdata database. It was shown from the results that highest evapotranspirationoccured in February, and lowest occurred in July. It was further observed that reference Evapotranspiration of the study area has a positive correlation coefficient of 0.9927 with the maximum temperature and a negative correlation coefficient of 0.1879 with the minimum temperature. Conclusively, it was stated that reference evapotranspiration was higher in the study area in dry season than in rainy season, and that it was directly proportional to the maximum temperature and inversely to the minimum temperature. Oyibo Muazu | Abdullahi Ayegba "Assessing the Monthly Variation of Reference Evapotranspiration of Nsukka, Enugu State, Nigeria" Published in International Journal of Trend in Scientific Research and Development (ijtsrd), ISSN: 2456-6470, Volume-2 | Issue-3 , April 2018, URL: https://www.ijtsrd.com/papers/ijtsrd11409.pdf Paper URL: http://www.ijtsrd.com/engineering/electronics-and-communication-engineering/11409/assessing-the-monthly-variation-of-reference-evapotranspiration-of-nsukka-enugu-state-nigeria/oyibo-muazu<br>

E N D
International Research Research and Development (IJTSRD) International Open Access Journal Assessing the Monthly Variation of Reference Evapotranspiration of Nsukka, Enugu State, Nigeria Evapotranspiration of Nsukka, Enugu State, Nigeria International Journal of Trend in Scientific Scientific (IJTSRD) International Open Access Journal ISSN No: 2456 ISSN No: 2456 - 6470 | www.ijtsrd.com | Volume 6470 | www.ijtsrd.com | Volume - 2 | Issue – 3 Assessing the Evapotranspiration of Nsukka, Enugu State, Nigeria Monthly Variation of Reference Oyibo Muazu Oyibo Muazu1, Abdullahi Ayegba2 1Radio Astronomy Division, 2Department of Engineering and Space Systems, National Space Research and Development Agency (NASRDA), Abuja, and Mathson Research Centre (NASRDA), Abuja, and Mathson Research Centre- A division of Mathson Group of Schools, Nigeria Division, Centre for Basic Space Science, Nsukka, Nigeria Space Science, Nsukka, Nigeria Department of Engineering and Space Systems, National Space Research and Development Agency Department of Engineering and Space Systems, National Space Research and Development Agency A division of Mathson Group of Schools, Nigeria ABSTRACT The application of suitable water quantity to the crops in irrigation farming is very important for effective crop yields as less or more than the required quantity of water when applied will affect the crop output negatively. The objective of this work was to determine the monthly reference Evapotranspiration of Nsukka, Enugu state of Nigeria, as well as how its variation is affected by temperature change. This work made use of Hargreaves-Samani model of evapotranspiration prediction, using the data of minimum and maximum temperature NASA’s earthdata database. It was shown from the results that highest evapotranspirationoccured in February, and lowest occurred in July. It was further observed that reference Evapotranspiration of the study area has a positive correlation 0.9927 with the maximum temperature and a negative correlation coefficient of -0.1879 with the minimum temperature. Conclusively, it was stated that reference evapotranspiration was higher in the study area in dry season than in rainy season, and that it was directly proportional to the maximum temperature and inversely to the minimum temperature. water quantity to the crops water in a form of vapour through the stomata in the leaves (Gujahar&Ayegba, Evapotranspiration is the combination of evaporation and transpiration which means the process movement or giving off of water vapour from the soil, water bodies as well as plants into the air or atmosphere. bodies as well as plants into the air or atmosphere. water in a form of vapour through the stomata in the leaves (Gujahar&Ayegba, Evapotranspiration is the combination of evaporation and transpiration which means the process movement or giving off of water vapour from the soil, water in irrigation farming is very important for effective crop yields as less or more than the required quantity of water when applied will affect the crop output negatively. The objective of this work was to eference Evapotranspiration of Nsukka, Enugu state of Nigeria, as well as how its variation is affected by temperature change. This 2017). 2017). Thus, Thus, Reference Evapotranspiration Evapotranspiration ranspiration rate of short green crops (grass), completely shading the ground, of uniform height and with adequate water status in the soil profile. In order words, it is mainly concerned with crops rather than other tall plants in an area as regards how water is given off by them into the atmosphere at a particular Reference evapotranspiration rate of short green crops (grass), completely shading the ground, of uniform height and with adequate water status in the soil profile. In order words, it is mainly concerned with crops rather than other tall plants in an area as regards how w given off by them into the atmosphere at a particular time. (ETo) (ETo) is is the the Samani model of evapotranspiration prediction, using the data of obtained from NASA’s earthdata database. It was shown from the results that highest evapotranspirationoccured in February, and lowest occurred in July. It was further observed that reference Evapotranspiration of the study area has a positive correlation coefficient of 0.9927 with the maximum temperature and a negative 0.1879 with the minimum temperature. Conclusively, it was stated that reference evapotranspiration was higher in the study area in dry The evapotranspiration of an area is that it is used to estimate the actual Evapotranspiration (ET), and which is calculated from the product of crop fficient (kc) and the reference evapotranspiration (ETo). Reference evapotranspiration (ETo) is the same for all crops but actual evapotranspiration varies since it depends on the crop coefficient which in turn depends on the specified crop as well as its stage of The evapotranspiration of an area is that it is used to estimate the actual Evapotranspiration (ET), and which is calculated from the product of crop coefficient (kc) and the reference evapotranspiration (ETo). Reference evapotranspiration (ETo) is the same for all crops but actual evapotranspiration varies since it depends on the crop coefficient which in turn depends on the specified crop as well as its growth (Jalal, 2014) advantage advantage of of calculating calculating reference reference , and that it was directly proportional to the maximum temperature and Keywords: Harmattan, Irrigation farming, Temperature Irrigation farming, Temperature Atmosphere, Evapotranspiration, Evapotranspiration, Reference evapotranspiration (ETo), according to (Allen et al. 1998), is an important parameter for agro-meteorological for the studies of climate and hydrology, as well as for irrigation planning and management. Thus, estimat evapotranspiration of a location such Nsukka, Enugu evapotranspiration of a location such Nsukka, Enugu Reference evapotranspiration (ETo), according to (Allen et al. 1998), is an important parameter for meteorological for the studies of climate and hydrology, as well as for irrigation planning and management. Thus, estimating 1.0.INTRODUCTION Evaporation deals with the movement of water to t air from sources such as soil, water bodies and canopy interception, while transpiration deals with the movement of water within a plant as well as loss of movement of water within a plant as well as loss of Evaporation deals with the movement of water to the air from sources such as soil, water bodies and canopy interception, while transpiration deals with the the reference @ IJTSRD | Available Online @ www.ijtsrd.com @ IJTSRD | Available Online @ www.ijtsrd.com | Volume – 2 | Issue – 3 | Mar-Apr 2018 Apr 2018 Page: 1323
International Journal of Trend in Scientific Research and Development (IJTSRD) ISSN: 2456-6470 state as in the case of this work will help in climate, hydrology as well as irrigation planning. security by Chineke et al., 2011. The work looked at seasonal and evapotranspiration for 36 state capitals of Nigeria and the federal capital, Abuja using data obtained from the International Water Management Institute (IWMI) for the period 1961-1990. It was observed in their work that monthly mean evapotranspiration ranged from 2.68 mm in the month of August at Port-Harcourt in the coastal part of the country to 9.08 mm for the month of March at Sokoto in the northern part of the country. d.CropEvapotranspiration- computing crop water requirements- FAO Irrigation and Drainage Paper 56 by Richard et al., 1998. regional trends of Also, according to (Zohrab, 1996), reference Crop Evapotranspiration (ETo) is an important element in hydrological studies. ETo is important in agricultural and urban planning, irrigation scheduling, studying of regional water balance and agro-climatological zoning. The temperature based model is one of the most widely used models for evapotranspiration (Mohammed, 2015). Some of these models are Hargreave-Samani model, Blaney- Criddle model, Schendel model and Thorntwaite model, this work made use of Hargreave-Samani. the estimation of Guidelines for Although, some similar works have been done by some scientists in some parts of the country, this work focuses on Nsukka, a local government in Enugu state, south-east Nigeria. 3.0 MATERIALS AND METHOD I. Materials The data used in this work is a secondary data of average monthly maximum temperature (July1, 1983 – June 30, 2005) obtained from earthdata.nasa.gov. Other material used is Microsoft excel software package. 2.0. LITERATURE REVIEW and minimum Some of the works reviewed in the course of this study are a.A Study Of Reference Evapotranspiration Of Abuja, Nigeria by Gujahar and Ayegba, 2017. The work made use of data of maximum and minimum temperature for December and June 2015 and December 2016 obtained from weather online limited database. The result showed that the daily reference evapotranspiration of the study area was higher in dry season (December) than in rainy season (June) due to higher solar radiation in dry season. b.Evaluation of Evapotranspiration using FAO Penman-Monteith Method in Kano Nigeria by Isikwueet al.,2014. Their work evaluated the reference evapotranspiration, ETo for Kano using the FAO Penman-Monteith Method, and the data (1977-2010) used was obtained from International Institute for Tropical Agriculture, Ibadan. It was observed by them that the highest reference evapotranspiration (125.08mm/day) occurred in February and the lowest (60.406 mm/day) occurred in August. The observation was attributed to high air humidity and presence of cloud in August and dryness of weather in February. c.Seasonal evapotranspiration signatures under a changing landscape and ecosystem management in Nigeria: Implications for agriculture and food II. Method: The work makes use of Hargreaves- Samani model of evapotranspiration prediction. Hargreaves-Samani model is the model which is used to estimate reference evapotranspiration of an area if maximum and minimum temperatures are the only available data. Microsoft excel worksheet was used for the mathematical computations to obtain the necessary parameters, and plotting of graphs. The evapotranspirationmodel is given (Hargreaves and Samani, 1985) as: Hargreaves-Samani reference 238 8 . ET 0135 . 0 ( T 17 78 . ) R O s 595 5 . . 0 55 T ----- 1 Where T is the mean daily temperature in 0c, Rs is the global solar radiation in MJ/m2day, and ETois the reference evapotranspiration in mm/day. Procedure i. Solar radiation declination: Solar radiation declination is defined as the angle made between a ray of the sun, when extended to the centre of the earth and the equatorial plane. The solar radiation @ IJTSRD | Available Online @ www.ijtsrd.com | Volume – 2 | Issue – 3 | Mar-Apr 2018 Page: 1324
International Journal of Trend in Scientific Research and Development (IJTSRD) ISSN: 2456-6470 declination is represented mathematically (Iqbal, 1983; Zekai, 2008) as; max R K T T R ---------------- 6 s RS min a Where Tmax is the maximum temperature, Tmin is minimum temperature, Ra is the extraterrestrial solar radiation of the area and KRs is adjustment coefficient. For 'interior' locations, where land mass dominates and air masses are not strongly influenced by a large water body, KRs is approximately 0.16 and for 'coastal' locations, situated on the coast of a large land mass and where air masses are influenced by a nearby water body, KRs is approximately 0.19 (Hargreaves and Samani, 1985). KRs is 0.16 in this work. 2 . 0 409 Sin J . 1 39 365 ----------- 2 where J is the number of the day in the year between 1 (1 January) and 365 or 366 (31 December) and solar radiation declination in radian. is ii.Inverse relative distance Earth-sun: Inverse relative distance Earth-sun is the inverse distance of the sun relative to the earth at a location. It is represented (Iqbal, 1983; Zekai, 2008) as; vi. Mean temperature: Mean temperature is obtained from the average of the monthly maximum and minimum temperatures. The mean temperature is calculated using the equation given as; 2 J dr 1 . 0 033 Cos 365 ---- 3 T T min max T iii. Sunset angle: Sunset angle is defined as the angle of the daily disappearance of the sun below the horizon due to the rotation of the earth. Sunset time is the time in which the trailing edge of the sun’s disk disappears below the horizon. It is determined using the formula given (Iqbal, 1983; Zekai, 2008) as: tan( ) tan( Cos s 2 ------------------------------ 7 vii. Calculation of reference evapotranspiration: Evapotranspiration is the sum of the evaporation and plant transpiration from the earth’s land and ocean surface to the atmosphere. evapotranspiration is calculated using the formula given (Hargreaves and Samani, 1985) as: Reference ) 1 ----------------- 4 238 8 . ET . 0 0135 ( T 17 . 78 ) R where radiation declination in radian, and of the location in radian. is sunset angle in radian, is the solar is latitude angle s O s 595 5 . . 0 55 T whereRs is the global solar radiation in MJ/m2day, T is the mean daily temperature in reference evapotranspiration in mm/day. 0c, and ETois the iv. Extraterrestrial solar radiation: Extraterrestrial solar radiation is the intensity or power of the sun at the top of the earth’s surface. The extraterrestrial radiation is calculated using the formula given (Iqbal, 1983; Zekai, 2008) as: 4.0 RESULTS AND DISCUSSIONS Table evapotranspiration, temperatures of the study area. The average reference evapotranspiration was calculated using the data of maximum and minimum temperatures. The table shows that the average reference evapotranspiration varied throughout the year with the highest evapotransiration occurring in February and the lowest in July. The evapotranspiration was 5.72mm/day while the minimum reference evapotranspiration 3.61mm/day. This means that the maximum amount of the water vapour that will be given off from the soil and the plants in the study area is 5.72mm and this will take place in the month of February. 1.0 shows the average and reference minimum maximum 24 60 ( ) ) s R G d w Sin ( ) Sin ( ) Cos ( ) Sin ( w a sc r s --- 5 whereRa is extraterrestrial radiation , dr is the inverse relative earth-sun distance, the study area, wsis the sunset angle,and Gsc is solar constant = 0.0820 MJ m-2 min-1 or 1367wm-2. is the latitude angle of maximum reference v. Global Solar Radiation: Global solar radiation is the total amount of solar energy received by earth’s surface. It is the sum of the direct, diffuse and reflected solar radiations. It is found using the formula given (Hargreaves and Samani, 1985) as: @ IJTSRD | Available Online @ www.ijtsrd.com | Volume – 2 | Issue – 3 | Mar-Apr 2018 Page: 1325
International Journal of Trend in Scientific Research and Development (IJTSRD) ISSN: 2456-6470 Table 1.0: Average Reference Evapotranspiration, Maximum and minimum temperatures 0c )T m i n ( 0c ) M o n t h s E T m a x ( T o (mm/day) J A N 5 . 5 2 2 3 8 . 6 2 0 . 8 F E B 5 . 7 2 2 3 8 . 6 2 1 . 7 M A R C H 4 . 8 9 2 3 4 . 6 2 3 A P R I L 4 . 5 2 8 3 2 . 9 2 3 . 3 Fig. 1.0: Average Reference Evapotranspiration graphical representation M A Y 4 . 2 4 7 3 2 . 1 2 3 . 3 Also, there was an increase from January to February which might be as a result of break in harmattan or its total termination paving way for rain or more humid atmosphere from March . The least evapotraspiration recorded in July was as a result of heavy rainfall during that period. After this month, the gradual reduction in the amount of rainfall experienced in the placed led to the continuous but slow increase in the level of evapotranspiration till the end of the year. J U N E 3 . 7 2 0 3 0 . 1 2 2 . 5 J U L Y 3 . 6 1 7 2 9 . 2 2 1 . 6 A U G U S T 3 . 8 3 3 2 9 . 5 2 1 . 3 S E P T 3 . 8 5 3 2 9 . 6 2 1 . 7 O C T 3 . 9 4 6 3 0 . 3 2 1 . 9 N O V 4 . 1 7 2 3 1 . 6 2 1 . 3 D E C 4 . 8 7 0 3 5 2 0 The trend of the variation of the reference evapotranspiration is such that it increased from January to February which was the peak, and then started decreasing slowly until the month of July where the lowest level was reached. The reference evapotranspiration then started rising until it reaches December before another decrease in January (Figures 1.0 and 2.0). As stated, there was a decrease in the value of reference evapotranspiration between December and January, this might be as a result of harmattan which will be charaterised with moist atmosphere thereby reducing the amount of water vapour given off from the earth’s surface as well as by plants. Fig. 2.0: Average Reference Evapotranspiration bar chart representation The implication is that irrigation farmers would have to study this trend for effective application of water to their crops since Nsukka is well know for the growing of tomatoes, perpe, potatoes, coco yam, maize and many other crops during dry season with some mostly grown with irrigation. For instance, perpe is a biannual crop, that is; it spends two years life span before it dies. This is possible when the temperature is not much, and when there is sufficient water in the soil to sustain it during dry season. In this study area where the evapotranspiration is somewhat high, @ IJTSRD | Available Online @ www.ijtsrd.com | Volume – 2 | Issue – 3 | Mar-Apr 2018 Page: 1326
International Journal of Trend in Scientific Research and Development (IJTSRD) ISSN: 2456-6470 especially fron December to March, there is need for artifcial or additional water to be applied to crops such as perpe in order to sustain them during this period. In addition, crops like tomatoes will continue to produce if adequate water is apllied, and at the right time. In other words, the amount of water applied to the farmland in December will be less than that which will be applied in January, and the one that will be applied to the farmland in January will be less than that is February (Table 1.0). This work will be of immense benefit to the farmers in this study area. temperature has more effects when compared to that of minimum temperature temperature has 99.28% relationship with the reference evapotranspiration temperature has 18.79% relationship with the reference evapotranspiration. Furthermore, even though it has been observed that both temperatures have effects on reference evapotranspiration, the positive correlation coefficient (0.9928) between the maximum temperature evapotranspiration shows evapotranspiration increases maximum temperature and vice versa. Also, the negative correlation coefficient (-0.1879) between the minimum temperature evapotranspiration shows evapotranspiration increases minimum temperature and vice versa. because maximum while minimum and that with reference reference increase in Figure 3.0 shows the graphical relationship between the averagereference evapotranspiration, maximum and minimum temperatures. It can be observed from the figure that average reference evapotranspiration is mostly related to the maximum temperature (Tmax) when the trend of the changes in both are compared even though that change in the average reference evapotranspiration is not as noticeable as in maximumtemperature. From the beginning of the year, both of them were increasing, then decreasing and again increasing almost at equal points. and that with reference reference decrease in 5.0 CONCLUSION The monthly average reference evapotranspiration of the Nsukka (Lat 6.840N, Long 7.370E), South-East Nigeria has been determined using Hargreaves- Samani method. The study made use of data of minimum and maximum temperature of NASA’s earthdata database for twenty two years (July1, 1983 – June 30, 2005). From the result, it was observed that higher average reference experienced in the study area from December to March with February having the peak level while July has the least level of evapotranspiartion. It can be concluded from the evapotranspiration is higher in dry season and lower in rainy season because less water is given off into the atmosphere. It can also be concluded that although reference evapotranspiration is affected by both maximum and minimum temperature, maximum temperature (correlation coefficient of 99.28%) has more effect on it than minimum temperature (correlation coefficient of 18.79%). evapotranspirationwas result that reference Fig 3.0: Monthly Average Reference Evapotranspiration, maximum and minimum temperatures graphical representation Finally, due to positive and negative correlation coefficient between reference evapotranspiration in relation to the maximum and minimum temperature respectively, it will be concluded that reference evapotranspiration of the study area is directly proportional to the maximum temperature and inversely to the minimum temperature. With further comparison, the correlation analysis of average reference evapotranspiration, maximum and minimum temperatures were carried out using Pearson correlation method in excel worksheet. It was discovered that the correlation coefficient between the average reference evapotranspirationand maximum temperature was0.9928 , while the coefficient between the minimum 0.188.Therefore, both the maximum and minimum temperatures have effect evapotranspiration of the study area but maximum temperature was - on the reference @ IJTSRD | Available Online @ www.ijtsrd.com | Volume – 2 | Issue – 3 | Mar-Apr 2018 Page: 1327
International Journal of Trend in Scientific Research and Development (IJTSRD) ISSN: 2456-6470 11.Ugwu, A. I. and Ugwuanyi, J. U. (2011). Performance assessment of Hargreaves model in estimating solar radiation in Abuja using minimum climatological Journal of the Physical Sciences. 12.Richard G. ALLEN, Luis S. PEREIRA, Dirk RAES, Martin SMITH Evapotranspiration- Guidelines for computing crop water requirements- FAO Irrigation and Drainage Paper https//www.researchgate.net/publication/2357041 97 13.ZohrabSamani (1996) Estimating Solar Radiation and Evapotranspiration Climatological Data. University 6.0 RECOMMENDATIONS It is recommended that other models for determining reference evapotranspiration of an area be used for the same area since this work made use of Hargreaves- Samani method. data, International (1998). Crop REFERENCES 1.Allen G R. Pereira S L, Raes D, and Smith , M. (1998): Crop evapotranspiration: Guidelines for computing crop water requirements. Food and Agricultural Organization of the United Nations (FAO) Rome.Publication No. 56. 2.Chineke T. C, Idinoba M. E and Ajayi O. C (2011): Seasonal evapotranspiration signatures under a changing landscape and ecosystem management in Nigeria: Implications for agriculture and food security, American. J. Sci. Ind. Res., Vol 2(2), Pp 191-204. 3.Fernandez J. E., Green S. R., Caspari H. W., Diaz- Espejo A., Cuevas M. V. (2008). The use of sap flow measurements for scheduling irrigation in Oolives apple and Asian pears trees and in grape vines. 4.Gordon Bonan (2014): Modeling terrestrial ecosystems: Biogeophysics& processes,National Center Research Boulder, Colorado, USA. Pg 1-35. 5.Gujahar R. D. R, and AbdullahiAyegba (2017). A study of Reference Evapotranspirationof Abuja, Nigeria. International Journal for Research &Development in technology. (8)2. Pp 72-78 6.Hargreaves, G. and Samani, Z. (1982). Estimating potential evapotranspiration.Journal of Irrigation and Drainage Engineering. 7.Iqbal M. (1983). An introduction to solar radiation, first ed. Academic press, New York. 8.Isikwue, C. Bernadette, Audu, O. Moses, Isikwue, O. Martin (2014). Evapotranspiration using FAO Penman-Monteith Method in Kano Nigeria. International Journal of Science and Technology 9.JalalShiri (2014): “How to calculate the actual evapotranspiration evapotranspiration?” www.researchgate.net/post/How_to_calculate_act ual_eva.... 10.Mohammad Valipour analysis of reference evapotranspiration models”, Wiley online library, Meteorol. Appl. 22, Pp 385- 394 56. Available at Using Minimum State New Mexico canopy for Atmospheric Evaluation of from potential (2015): “Temperature @ IJTSRD | Available Online @ www.ijtsrd.com | Volume – 2 | Issue – 3 | Mar-Apr 2018 Page: 1328