Download
1 / 3
30 likes | 33 Views
The PM10 concentration in the underground areas should be monitored to protect the health of the commuters in the underground subway system. The purpose of this work is to study the reliability of the instruments using light scattering method to measure the PM10 concentrations continuously. A linear regression analysis method is used to improve the performance of the instruments using light scattering method. Some experimental results show that a linear regression technique would be very helpful for the performance improvement of light scattering instruments such as Air test PM2500 and HCT 4103. Tae-In Hyon | Gyu-Sik Kim "Accuracy Improvement of PM Measuring Instruments" Published in International Journal of Trend in Scientific Research and Development (ijtsrd), ISSN: 2456-6470, Volume-3 | Issue-5 , August 2019, URL: https://www.ijtsrd.com/papers/ijtsrd26722.pdf Paper URL: https://www.ijtsrd.com/engineering/electrical-engineering/26722/accuracy-improvement-of-pm-measuring-instruments/tae-in-hyon<br>

E N D
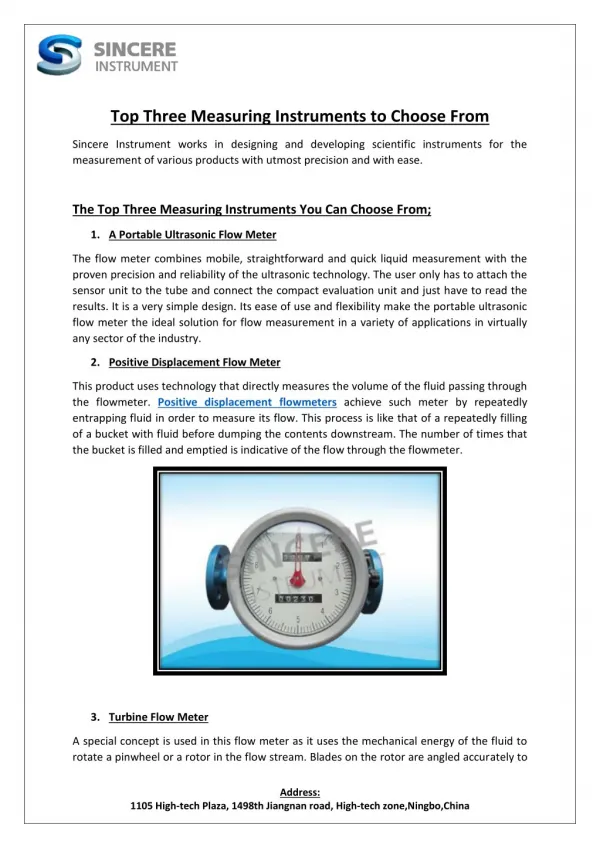
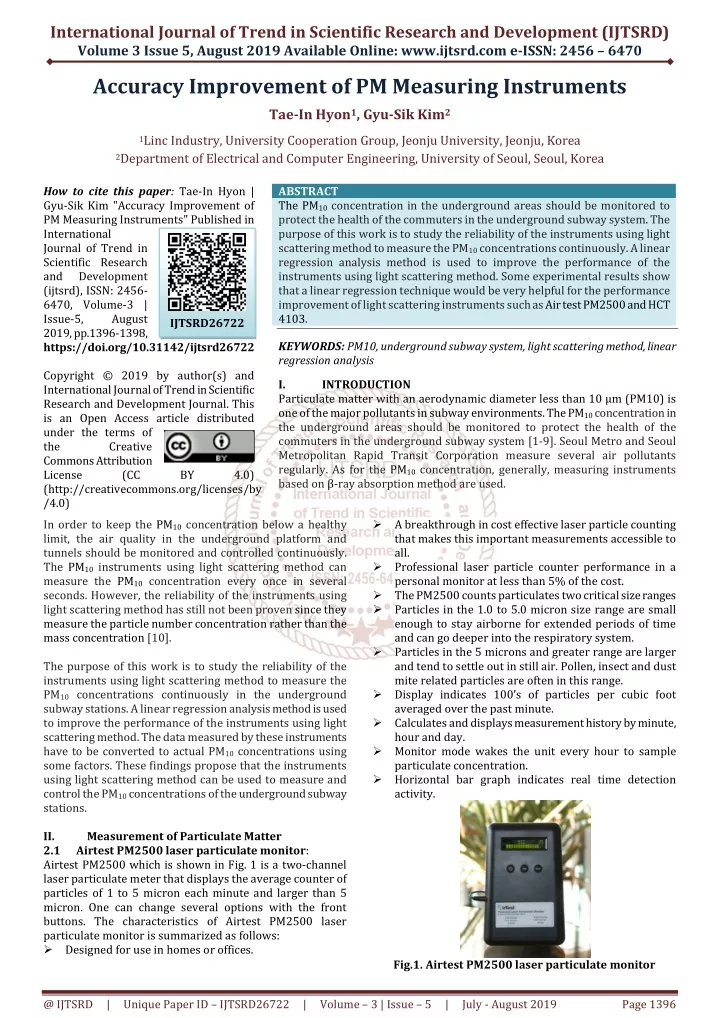
International Journal of Trend in Scientific Research and Development (IJTSRD) Volume 3 Issue 5, August 2019 Available Online: www.ijtsrd.com e-ISSN: 2456 – 6470 Accuracy Improvement of PM Measuring Instruments Tae-In Hyon1, Gyu-Sik Kim2 1Linc Industry, University Cooperation Group, Jeonju University,Jeonju, Korea 2Department of Electrical and Computer Engineering, University of Seoul, Seoul, Korea How to cite this paper: Tae-In Hyon | Gyu-Sik Kim "Accuracy Improvement of PM Measuring Instruments" Published in International Journal of Trend in Scientific Research and Development (ijtsrd), ISSN: 2456- 6470, Volume-3 | Issue-5, August 2019, pp.1396-1398, https://doi.org/10.31142/ijtsrd26722 Copyright © 2019 by author(s) and International Journal of Trend in Scientific Research and Development Journal. This is an Open Access article distributed under the terms of the Creative Commons Attribution License (CC (http://creativecommons.org/licenses/by /4.0) In order to keep the PM10 concentration below a healthy limit, the air quality in the underground platform and tunnels should be monitored and controlled continuously. The PM10 instruments using light scattering method can measure the PM10 concentration every once in several seconds. However, the reliability of the instruments using light scattering method has still not been proven since they measure the particle number concentration rather than the mass concentration [10]. The purpose of this work is to study the reliability of the instruments using light scattering method to measure the PM10 concentrations continuously in the underground subway stations. A linear regression analysis method is used to improve the performance of the instruments using light scattering method. The data measured by these instruments have to be converted to actual PM10 concentrations using some factors. These findings propose that the instruments using light scattering method can be used to measure and control the PM10 concentrations of the underground subway stations. II. Measurement of Particulate Matter 2.1 Airtest PM2500 laser particulate monitor: Airtest PM2500 which is shown in Fig. 1 is a two-channel laser particulate meter that displays the average counter of particles of 1 to 5 micron each minute and larger than 5 micron. One can change several options with the front buttons. The characteristics of Airtest PM2500 laser particulate monitor is summarized as follows: Designed for use in homes or offices. ABSTRACT The PM10 concentration in the underground areas should be monitored to protect the health of the commuters in the underground subway system. The purpose of this work is to study the reliability of the instruments using light scattering method to measure the PM10 concentrations continuously. A linear regression analysis method is used to improve the performance of the instruments using light scattering method. Some experimental results show that a linear regression technique would be very helpful for the performance improvement of light scattering instruments such as Air test PM2500 and HCT 4103. KEYWORDS:PM10, underground subway system, light scattering method, linear regression analysis I. INTRODUCTION Particulate matter with an aerodynamic diameter less than 10 μm (PM10) is one of the major pollutants in subway environments. The PM10 concentration in the underground areas should be monitored to protect the health of the commuters in the underground subway system [1-9]. Seoul Metro and Seoul Metropolitan Rapid Transit Corporation measure several air pollutants regularly. As for the PM10 concentration, generally, measuring instruments based on β-ray absorption method are used. IJTSRD26722 BY 4.0) A breakthrough in cost effective laser particle counting that makes this important measurements accessible to all. Professional laser particle counter performance in a personal monitor at less than 5% of the cost. The PM2500 counts particulates two critical size ranges Particles in the 1.0 to 5.0 micron size range are small enough to stay airborne for extended periods of time and can go deeper into the respiratory system. Particles in the 5 microns and greater range are larger and tend to settle out in still air. Pollen, insect and dust mite related particles are often in this range. Display indicates 100’s of particles per cubic foot averaged over the past minute. Calculates and displays measurement history by minute, hour and day. Monitor mode wakes the unit every hour to sample particulate concentration. Horizontal bar graph indicates real time detection activity. Fig.1. Airtest PM2500 laser particulate monitor @ IJTSRD | Unique Paper ID – IJTSRD26722 | Volume – 3 | Issue – 5 | July - August 2019 Page 1396
International Journal of Trend in Scientific Research and Development (IJTSRD) @ www.ijtsrd.com eISSN: 2456-6470 The general specifications of Airtest PM2500 laser particulate monitor is summarized as follows: Sampling method: Laser particle counter. This device is a Class 1 laser product and complies with 21 CFR 1040.10 and 1040.11. Particle channels: 1.0-5.0 um, 5.0+ um Flow rate: 0.06 cfm nominal Concentration limit: Coincidence loss less than 10% at 1,000,000 particles/cubic foot Display format: Particles/cubic foot (divided by 100) averaged over 1 minute Data storage 60 minutes of minute averages, 24 hours of hourly averages, 30 day of daily averages Dimensions:7.5 x 5.0 x 3.5 inches Weight approximately 12 oz Power: 9VDC, 400mA, 110VAC plug-in transformer provided. 2.2 HCT 4103 particle sensor: HCT 4103 particle sensor is shown in Fig. 2. Power: 220 VAC, 60Hz 2.3 Linear regression analysis: Generally, a linear regression straight line is expressed as eq (1). ˆ ˆ y mx b (1) Fig.3. Approximation to a straight line In Fig. 3, the data dotted in small circles can be approximated to a straight line using a linear regression analysis method. The error e can be expressed in eq (2) N e y mx b In order to find the unknown variables ˆ m and ˆb which minimize the error e , the partial differentiations are used as N e x y mx b m e y mx b b From eq (3), we can get eq (4). N N N m x b x x y ˆ 2 ˆ (2) ( ( )) i i i 1 ˆ ˆ 2 ( ( )) 0 i i i ˆ i 1 (3) N ˆ ˆ 2 ( ( )) 0 ˆ i i i 1 ˆ 2 i ˆ i i i (4) Fig.2. HCT 4103 particle sensor i 1 i 1 i 1 N N A light scattering particle sensor provides an extremely sensitive tool for the measurement of aerosol concentration and particle size. HCT Particle Sensor model 4103 can provide instantaneous and continuous particle monitoring information. The characteristics of HCT 4103 particle sensor is summarized as follows: Compact, convenient, light weight Sizing sensibilities from 0.3 ~ 10 ㎛ Easy to install in narrow space Smooth, durable exterior design Real time data display Easy system interface Compliant with JIS standards The general specifications of HCT 4103 particle sensor is summarized as follows: Size range: 0.3 ~ 10 ㎛ Flow rate: 0.1 CFM (2.83 L/min) Counting efficiency: 50% @ 0.3 ㎛, 100% for particles > 0.45 ㎛ (meets JIS) Laser source: Laser diode Zero count level: < 1 count / 5 minutes (meets JIS) Vacuum requirements: External vacuum Maximum particle concentration: 5,000,000 particles/ft3 Front panel display: LCD panel Output interface: RS422 Dimensions(LWH): 84 X 105 X 60 mm Weight: 0.5 kg ˆ ˆ m x bN y i i i 1 i 1 Eq (5) can be obtained using eq (4). N N x y m N x N N x y i i i i ˆ i 1 i 1 i 1 N N (5) 2 i 2 ( x ) i i 1 i 1 N N 1 N ˆ ˆ b ( y m x ) i i i 1 i 1 2.4 The PM measuring instruments Airtest PM2500 and HCT 4103 were installed at a subway station for 480 minutes as shown in Fig. 4. The PM10 measurement data of Airtest PM2500 and HCT 4103 are shown in Fig. 5. Using the linear regression analysis technique, the measured PM10 concentration of Airtest PM2500 in Fig. 5 can be corrected as shown in Fig. 6. The PM2.5 measurement data of Airtest PM2500 and HCT 4103 are shown in Fig. 7. Using the linear regression analysis technique, the measured PM2.5 concentration of Airtest PM2500 in Fig. 7 can be corrected as shown in Fig. 8. It can also be seen in Fig. 6 and Fig. 8 that the measurement data of Airtest PM2500 was closely similar as those of HCT 4103 if they were corrected using a linear regression technique. So, it can be concluded that a linear regression technique would be very helpful for the performance improvement of light scattering instruments such as Airtest PM2500 and HCT 4103. Application of linear regression analysis: @ IJTSRD | Unique Paper ID – IJTSRD26722 | Volume – 3 | Issue – 5 | July - August 2019 Page 1397
International Journal of Trend in Scientific Research and Development (IJTSRD) @ www.ijtsrd.com eISSN: 2456-6470 III. The metropolitan city of Seoul uses more energy than any other area in South Korea due to its high population density. It also has high emissions of air pollutants. Since an individual usually spends most of his/her working hours indoors, the ambient air quality refers to indoor air quality. In particular, PM10 concentration in the underground areas should be monitored to preserve the health of commuters in the subway system. Through some experimental studies, we found that a linear regression technique would be very helpful for the performance improvement of light scattering instruments such as Airtest PM2500 and HCT 4103. These findings propose that the instruments using light scattering method can be used to measure and control the PM10 concentrations of the underground subway stations. Acknowledgment This work was supported by the 2019 Research Fund of the University of Seoul References [1]Jihan Song, Heekwan Lee, Shin-Do Kim, and Dong-Sool Kim, "How about the IAQ in subway environment and its management," Asian Journal of Atmospheric Environment, vol.2, no.1, pp.60-67, June, 2008 [2]Youn-Suk Son, Young-Hoon Kang, Sang-Gwi Chung, Hyun Ju Park, and Jo-Chun Kim, "Efficiency evaluation of adsorbents for the removal of VOC and NO2 in an underground subway station," Asian Journal of Atmospheric Environment, vol.5, no.2, pp.113-120, June, 2011 [3]Kyung Jin Ryu, MakhsudaJuraeva, Sang-Hyun Jeong, and Dong Joo Song, "Ventilation efficiency in the subway environment for the indoor air quality," World Academy of Science, Engineering and Technology,vol.63, pp.34-38, March, 2012 [4]Youn-Suk Son, Trieu-Vuong Dinh, Sang-Gwi Chung, Jai- hyo Lee, and Jo-Chun Kim, "Removal of particulate matter emitted from a subway tunnel using magnetic filters," Environmental Science & Technology, vol.48, pp.2870-2876, Feb., 2014 [5]Ki Youn Kim,, Yoon Shin Kim, Young Man Roh, Cheol Min Lee, Chi Nyon Kim, "Spatial distribution of particulate matter (PM10 and PM2.5) in seoul metropolitan subway stations," Journal of Hazardous Material, vol.154, pp.440-443, June, 2008 [6]Soon-Bark Kwon, Youngmin Cho, Duckshin Park, Eun- Young Park, "Study on the indoor air quality of seoul metropolitan subway during the rush hour," Indoor Built Environment, vol.17, no.4, pp.361-369, 2008 [7]Soon-Bark Kwon, Duckshin Park, Youngmin Cho, Eun- Young Park, "Measurement of natural ventilation rate in seoul metropolitan subway cabin," Indoor Built Environment, vol.19, no.3, pp.366-374, 2010 [8]Aarnio, P., et al., "The concentrations and composition of exposure to fine particle (PM2.5) in the Helsinki subway system," Atmospheric Environment, vol.39, pp.5059-5066, 2005 [9]Branis, M., "The contribution of ambient sources to particulate pollution in spaces and trains of the Prague underground transport Environment, vol.40, pp.348-356, 2006 [10]Gyu-Sik Kim, Joon-Tae Oh, "Performance improvement of PM10 sensors using linear regression analysis," Global Journal of Engineering Science and Researches, vol.2, no.4, pp.1-6, April, 2015 Concluding Remarks Fig.4. The PM measuring instruments Airtest PM2500 and HCT 4103 installed at a subway station Fig.5. PM10 measurement data of Airtest PM2500 and HCT 4103 (Before correction) Fig.6. PM10 measurement data of Airtest PM2500 and HCT 4103 (After correction) Fig.7. PM2.5 measurement data of Airtest PM2500 and HCT 4103 (Before correction) system," Atmospheric Fig.8. PM2.5 measurement data of Airtest PM2500 and HCT 4103 (After correction) @ IJTSRD | Unique Paper ID – IJTSRD26722 | Volume – 3 | Issue – 5 | July - August 2019 Page 1398