Download
1 / 1
10 likes | 103 Views
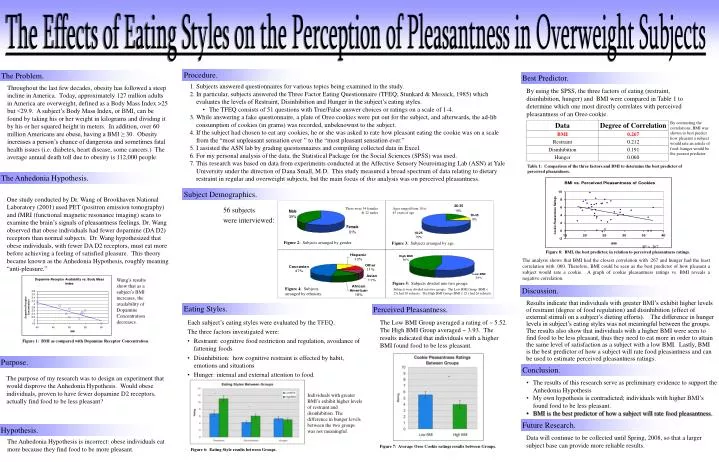
The Effects of Eating Styles on the Perception of Pleasantness in Overweight Subjects. Procedure. The Problem. Best Predictor.

E N D
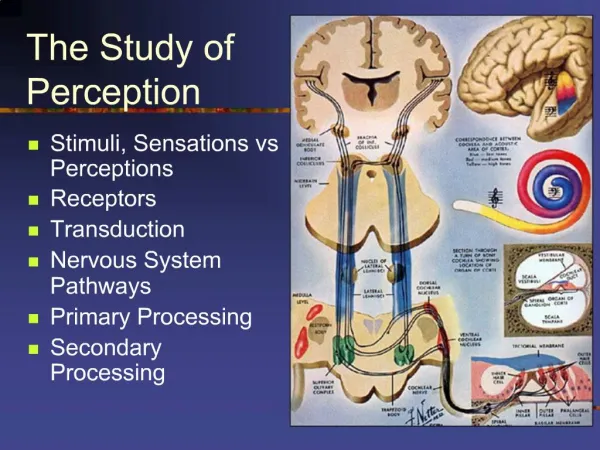
The Effects of Eating Styles on the Perception of Pleasantness in Overweight Subjects Procedure. The Problem. Best Predictor. Throughout the last few decades, obesity has followed a steep incline in America. Today, approximately 127 million adults in America are overweight, defined as a Body Mass Index >25 but <29.9. A subject’s Body Mass Index, or BMI, can be found by taking his or her weight in kilograms and dividing it by his or her squared height in meters. In addition, over 60 million Americans are obese, having a BMI ≥ 30. Obesity increases a person’s chance of dangerous and sometimes fatal health issues (i.e. diabetes, heart disease, some cancers.) The average annual death toll due to obesity is 112,000 people. • Subjects answered questionnaires for various topics being examined in the study. • In particular, subjects answered the Three Factor Eating Questionnaire (TFEQ; Stunkard & Messick, 1985) which evaluates the levels of Restraint, Disinhibition and Hunger in the subject’s eating styles. • The TFEQ consists of 51 questions with True/False answer choices or ratings on a scale of 1-4. • While answering a fake questionnaire, a plate of Oreo cookies were put out for the subject, and afterwards, the ad-lib consumption of cookies (in grams) was recorded, unbeknownst to the subject. • If the subject had chosen to eat any cookies, he or she was asked to rate how pleasant eating the cookie was on a scale from the “most unpleasant sensation ever ” to the “most pleasant sensation ever.” • I assisted the ASN lab by grading questionnaires and compiling collected data in Excel. • For my personal analysis of the data, the Statistical Package for the Social Sciences (SPSS) was used. • This research was based on data from experiments conducted at the Affective Sensory Neuroimaging Lab (ASN) at Yale University under the direction of Dana Small, M.D. This study measured a broad spectrum of data relating to dietary restraint in regular and overweight subjects, but the main focus of this analysis was on perceived pleasantness. By using the SPSS, the three factors of eating (restraint, disinhibition, hunger) and BMI were compared in Table 1 to determine which one most directly correlates with perceived pleasantness of an Oreo cookie. By contrasting the correlations, BMI was shown to best predict how pleasant a subject would rate an article of food; hunger would be the poorest predictor. Table 1: Comparison of the three factors and BMI to determine the best predictor of perceived pleasantness. The Anhedonia Hypothesis. One study conducted by Dr. Wang of Brookhaven National Laboratory (2001) used PET (positron emission tomography) and fMRI (functional magnetic resonance imaging) scans to examine the brain’s signals of pleasantness feelings. Dr. Wang observed that obese individuals had fewer dopamine (DA D2) receptors than normal subjects. Dr. Wang hypothesized that obese individuals, with fewer DA D2 receptors, must eat more before achieving a feeling of satisfied pleasure. This theory became known as the Anhedonia Hypothesis, roughly meaning “anti-pleasure.” Subject Demographics. 26-35 56 subjects were interviewed: There were 34 females & 22 males Ages ranged from 18 to 45 years of age Figure 2: Subjects arranged by gender. Figure 3: Subjects arranged by age. R² = .267 Figure 8: BMI, the best predictor, in relation to perceived pleasantness ratings. The analysis shows that BMI had the closest correlation with .267 and hunger had the least correlation with .060. Therefore, BMI could be seen as the best predictor of how pleasant a subject would rate a cookie. A graph of cookie pleasantness ratings vs. BMI reveals a negative correlation. Wang’s results show that as a subject’s BMI increases, the availability of Dopamine Concentration decreases. Figure 5: Subjects divided into two groups. Discussion. Figure 4: Subjects arranged by ethnicity. Subjects were divided into two groups. The Low BMI Group (BMI < 25) had 30 subjects. The High BMI Group (BMI ≥ 25 ) had 26 subjects. Results indicate that individuals with greater BMI’s exhibit higher levels of restraint (degree of food regulation) and disinhibition (effect of external stimuli on a subject’s dieting efforts). The difference in hunger levels in subject’s eating styles was not meaningful between the groups. The results also show that individuals with a higher BMI were seen to find food to be less pleasant, thus they need to eat more in order to attain the same level of satisfaction as a subject with a low BMI. Lastly, BMI is the best predictor of how a subject will rate food pleasantness and can be used to estimate perceived pleasantness ratings. Eating Styles. Perceived Pleasantness. • Each subject’s eating styles were evaluated by the TFEQ. • The three factors investigated were: • Restraint: cognitive food restriction and regulation, avoidance of fattening foods • Disinhibition: how cognitive restraint is effected by habit, emotions and situations • Hunger: internal and external attention to food. The Low BMI Group averaged a rating of ~ 5.52. The High BMI Group averaged ~ 3.93. The results indicated that individuals with a higher BMI found food to be less pleasant. Figure 1: BMI as compared with Dopamine Receptor Concentration. Purpose. The purpose of my research was to design an experiment that would disprove the Anhedonia Hypothesis. Would obese individuals, proven to have fewer dopamine D2 receptors, actually find food to be less pleasant? Conclusion. • The results of this research serve as preliminary evidence to support the Anhedonia Hypothesis • My own hypothesis is contradicted; individuals with higher BMI’s found food to be less pleasant. • BMI is the best predictor of how a subject will rate food pleasantness. Individuals with greater BMI’s exhibit higher levels of restraint and disinhibition. The difference in hunger levels between the two groups was not meaningful. Future Research. Hypothesis. The Anhedonia Hypothesis is incorrect: obese individuals eat more because they find food to be more pleasant. Data will continue to be collected until Spring, 2008, so that a larger subject base can provide more reliable results. Figure 7: Average Oreo Cookie ratings results between Groups. Figure 6: Eating Style results between Groups.