Download

1 / 27
270 likes | 280 Views
SUTRA Project Update. Presented at SUTRA Meeting Thessaloniki Greece, August 2001 Presented by the Ministry of Environment, Israel Contact: Jacqueline Rose, Project Co-ordinator jacqueliner@environment.gov.il. Map of Israel. Haifa. Hadera. Netanya. Tel Aviv.

E N D
SUTRA Project Update Presented at SUTRA Meeting Thessaloniki Greece, August 2001 Presented by the Ministry of Environment, Israel Contact: Jacqueline Rose, Project Co-ordinator jacqueliner@environment.gov.il
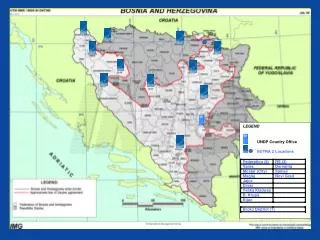
Map of Israel Haifa Hadera Netanya Tel Aviv Study area: Tel Aviv Region = Pink Gush Dan/Sharon Region =Blue Ashdod
Model Input Data Input Data Status Output Data Running of Model Transport Demand Data: number of trips between zones at peak hour for all Demand segments. Supply Data: transport system modes, nodes, links, zones for private and public transport. Yes For Emissions Model: Traffic flux, vehicle velocity, number of hot and cold starts. For Energy & Economic Model: Traffic speeds, traffic volume. Israel Transport (VISUM) Model Work done: Data collection, data processing, (changing the data format from Emme2 to Visum, creating the capacity field due to “Neta’s” instructions) data input, building of network. Still to do: Model assignment and matrix.
Transport (VISUM) Model Phase 1: Data Collection Link & Node tables – taken from Emme2 data, plus minor changes (adding Link Id, Capacity, Other fields) Turning Relation – includes all (and only) forbidden turns Zone table – composed of 600 centroids Connectors – one connector to each zone Other required data: Demand Segment, Mode, Netpara, Node Type, Tsys, Version
Transport (VISUM) Model Phase 2: Import the network into VISOM…. And the result is…
Transport (VISUM) Model Emme2 Phase 3: Translating the nodes ids from the origin data (Emme2) to zones ids (required by Visum). Changing the matrix format. Preparation Visem
Transport (VISUM) Model Phase 4: Reading Matrix and Assignment Not Done Yet……Due to technical problems Points: • Currently working with private transport system only! (will add public transport system later) • Technical problems with running of the model (led to delays). e.g. Tel Aviv has 601 zones, model only takes 600 Language bugs Problems with “assignment” prevent concluding stage.
Model Input Data Input Data Status Output Data Running of Model Emissions Fuel consumption, vehicle park, driving conditions, fuel properties, ambient temperatures, EC legislation, National Emission Factors. Yes (Vehicle park for Israel – Tel Aviv is approx half) For Street Canyon Model: Quantity of pollutants from vehicles (hourly for each road segment). Emissions Model Averio Work done: Data collection complete (for ambient temperature see OFIS). Still to do: Confirm all the data with University of Aveiro. Start running model.
Emissions Model - Data v_class.dat v_count_18_10.dat v_fleet.txt
Emissions Model - Data • Distribution of vehicles by category and class (for Israel). • Tel Aviv data is assumed to be half.
Emissions Model – Fuel Properties Fuel Properties: Sulphur (ppm) B - 350 ppm D - 350 ppm The B was 500 in 98, the 350 is estimate base on reduction in the level. Lead (g/l) B - 0.15 (with lead) 0.013 (unleaded) D - NA Should be reduced from 0.15 to 0.10 by the end of this year Aromatics (vol.,%) B - for 98 was no limit, D - 11% for polyaromatics Density at 15? C (kg/m3) B - 715-780, D – 845 RVP, fuel volatility (kPa) B - 45-66 D - NA
Model Input Data Input Data Status Output Data Running of Model VADIS Simulation domain, traffic counting for domain (street), dimensions/volume of buildings, population data, air quality monitoring, meteorological data. Yes Still need: simulation domain measurements, meteorological data Wind field for each direction. 3D concentration field for selected times. Street Canyon (VADIS) Model Work done: Data collection (still need for domain measurements). All data has been sent and initial running of model was carried out in at Aveiro meeting. Awaiting response from University of Aveiro. Still to do: Complete data set, comprehensive model run. Averio
Street Canyon (VADIS) Model Map of simulation domain. Allenby Street
t0=296K dt/dz=0.6 GRID DATA SURFER LAYERS AIR TEMPERATURE (K) WIND AND TURBULENCE ISURF Wind velocity (m/s) 295.21 Length (m) Wind direction (°) Width (m) JSURF Height (m) Reference Height (m) Number of cells XROTDV (m) KSURF YROTDV (m) 24 50 NI 2 NJ NK 2.4 118 10 252 250 350 350 60 70 70 20 Street Canyon (VADIS) Model Wind Data
OBSTACLES GRID Sources Length (m) Description Description COORDINATES (m) Height (m) Source 1 Cell Length (m) Cell Height (m) Angle (°) Coordinates (m) 350 Interior left corner X1 350 -80 5 Superior right corner 5 X1 Y1 Y1 100 Z1 X2 Y2 Z2 Obstacle 1 -78 Z1 100 0 0 -68 75 10 0 Obstacle 2 -72 X2 72 -62 0 -62 42 10 0 Obstacle 3 -66 Y2 39 10 0 -56 9 10 0 Obstacle 4 -90 Z2 96 0 0 -81 71 10 0 Road width, H (m) Obstacle 5 -82 68 8 0 -75 43 10 0 Obstacle 6 Vertical thickness, V (m) -76 37 3 0 -68 10 10 0 Source type / ILINE Aligned/0 Street Canyon (VADIS) Model Dispersal Data
EMISSIONS (mg/s) Emission period Source 1 Source 2 Source 3 18.10.1998 07:00 - 08:00 120757* Wind direction, DIRVEN (°) 118 VELVEN 1 Street Canyon (VADIS) Model Emission Data * In output.txt, the output file of TREM model, the emissions rate of NOx for 8 a.m. is 2731.63 g/km.h. When I convert this value to g/s, I multiply by road length (0.2km).
Model Input Data Input Data Status Output Data Running of Model OFIS City data, meteorological data (with local circulation) boundary concentrations, urban, suburban and rural ground and elevated emission data, neighbouring city locations with ground and elevated emission data, land-use file. Yes Have part of industry and power station data. Concentration of pollutants for each grid location for each day of year. Background layer average concentration for whole domain. Ozone (OFIS) Model Work done: Data collection (except for some meteorological data and part of emission data). Still to do: Complete data set, comprehensive model run. Thesseloniki
Estimates for Air Pollutant Emission (2000) maximum hourly rates (kg/hr) Ozone (OFIS) Model – Map Map of study area. Urban Suburban Rural
Area Pollutant Population (thousands) Quantity (mircogr/m3) Size of Area (squared km) PM10 20 Tel Aviv Region 1,138.7 171 SO2 6 Gush Dan 1,358.2 1,276 NOx 127 O3 23.5 NO:NO2 70-80:20-30 Ozone (OFIS) Model - Data • City data (1998). • Background boundary layer concentrations. • Emission data. • Transport NOx & VOC’s from TREM model. • Industry and power stations: Have fuel demand (city and suburb areas), waiting for emission factors from Liana for conversion into NOx and VOC.
Ozone (OFIS) Model - Data Meteorological Data
Model Input Data Input Data Status Output Data Running of Model MARKAL “Kilometerage” for all transport vehicles (2000-2030), imported energy prices, imported energy CO2 content, transformation technology data, demand technology data. Yes Total discount system cost over a planned horizon of 45 years. Energy (MARKAL) Model Work done: Data collection complete. Still to do: Running the model - problems incurred so far! Have not been successful in running MARKAL. Geneva/ Israel
Model Input Data Input Data Status Output Data Running of Model Economic /Indicators Demography, landuse, economy, commuting and tele-working, passenger and freight transport, pollutant emission, atmospheric concentrations, transport statistics. Yes – have most data. Lack data on tele-working Used in Scenario Economic Indicator Model Work done: Data collection partially complete. Very little data (if any) on tele-working. May have a problem with some of the “Response” data. Still to do: Scenario development.
Economic Indicator Model Example of “driving forces” data.
Economic Indicator Model Example of “Pressure” data
Economic Indicator Model Example of “State” data
Other Points • Confirmation of who will be running the models. • Details about the Economic Indicators Model (and scenarios)