Download
1 / 28
280 likes | 466 Views
The CAPM . Class 11 Financial Management, 15.414 . Today . The CAPM Measuring risk Systematic vs. diversifiable risk The trade-off between risk and return Reading Brealey and Myers, Chapter 8.2 – 8.5. Review . Diversification

E N D
The CAPM Class 11 Financial Management, 15.414
Today The CAPM • Measuring risk • Systematic vs. diversifiable risk • The trade-off between risk and return Reading • Brealey and Myers, Chapter 8.2 – 8.5
Review Diversification • Diversification reduces risk, as long as stocks aren’t perfectly correlated with each other. • Portfolio variance depends primarily on the covariances among stocks, not the individual variances. Risk common to all firms cannot be diversified away. • Investors should try to hold portfolios that maximize expected return for a given level of risk. The tangency portfolio is the best portfolio.
Diversification Std dev of portfolio Number of stocks
Optimal portfolios Mean • Std dev
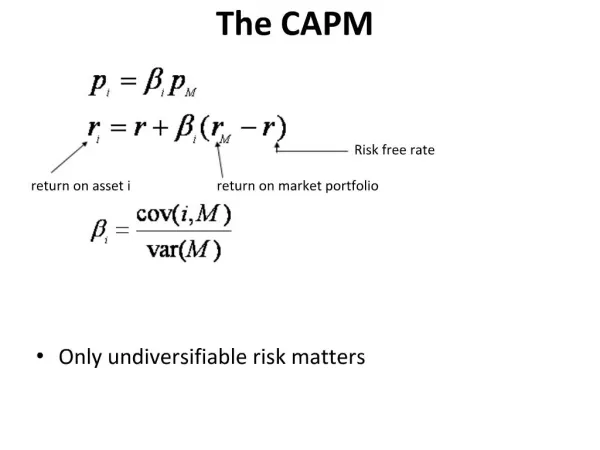
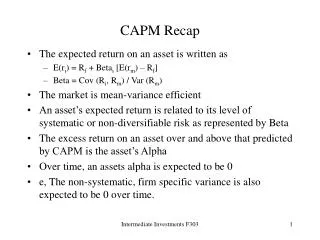
The CAPM Capital Asset Pricing Model • Stock prices are affected by firm-specific and marketwide risks. Investors care only about risk that is non-diversifiable. • A stock’s non-diversifiable risk is measured by beta, the slope when the stock is regressed on the market: • Expected, or required, returns are a linear function of betas: • Market risk premium • For example, a stock with β = 2 is twice as risky as the market, so investors require twice the risk premium.
CAPM: Security Market Line Stock's expected return Stock's beta
Beta Regression slope • How sensitive is the stock to overall market movements? How much does the stock go up or down when other stocks go up or down? • Ri = α + β RM + ε • ε = firm-specific return (‘diversifiable,’ ‘idiosyncratic,’ or ‘unsystematic’ risk) • β = sensitivity to market returns (‘systematic,’ ‘non-diversifiable,’ or ‘macroeconomic’ risk) • R2 = explained variance (fraction of variance explained by market returns)
Betas, 1960 – 2001 • Size-sorted portfolios
CAPM • Key insight • For a diversified investor, beta measures a stock’s contribution to portfolio risk. Beta, not variance, is the appropriate measure of risk. • The required return on a stock equals:
Security Market Line Stock's expected return Stock's beta
Example 1 • Using monthly returns from 1990 – 2001, you estimate that Microsoft has a beta of 1.49 (std err = 0.18) and Gillette has a beta of 0.81 (std err = 0.14). If these estimates are a reliable guide for their risks going forward, what rate of return is required for an investment in each stock? E[Ri] = rf + βi E[RM – rf] Tbill rate = 1.0%; market risk premium is around 4 – 6%. Expected returns Gillette: E[RGS] = 0.01 + (0.81 × 0.06) = 5.86% Microsoft: E[RMSFT] = 0.01 + (1.49 × 0.06) = 9.94%
Example 2 • Over the past 40 years, the smallest decile of firms had an average monthly return of 1.33% and a beta of 1.40. The largest decile of firms had an average return of 0.90% and a beta of 0.94. Over the same time period, the riskfree rate averaged 0.43% and the market risk premium was 0.49%. Are the average returns consistent with the CAPM? • E[Ri] = rf + βi E[RM – rf] Tbill rate = 0.43%; market risk premium is 0.49% • How far are average returns from the CAPM security market line?
Size portfolios, 1960 – 2001 Average returns vs. CAPM Difference = Avg. return – CAPM prediction
Size portfolios, 1960 – 2001 Return Beta
Example 3 • You are choosing between two mutual funds. Over the past 10 years, BlindLuck Value Fund had an average return of 12.8% and a β of 0.9. EasyMoney Growth Fund had a return of 17.9% and a β of 1.3. The market’s average return over the same period was 14% and the Tbill rate was 5%. • Which fund is better? [‘Dif’ is referred to as the fund’s ‘alpha’]
Example 3 Avg return Beta
CAPM • Applications • Measures and quantifies ‘risk’ One stock or project is riskier than another stock or project if it has a higher β. • Valuation The CAPM provides a way to estimate the firm’s cost of capital (risk-adjusted discount rate).* • Evaluating a stock or mutual fund’s risk-adjusted performance The CAPM provides a benchmark. * Graham and Harvey (2000) survey CFOs; 74% of firms use the CAPM to estimate the cost of capital.
Observation 1 • Portfolios • A portfolio’s beta is a weighted average of the betas of the individual stocks. • Stocks 1, …, N Portfolio return: RP = w1 R1 + w2 R2 + … + wN RN Individual stocks Portfolio What happens to the residual variance when more stocks are added?
Observation 1 • Example • Two groups of stocks Group 1: β = 0.5 Group 2: β = 1.5 • All stocks have a standard deviation of 40%. The market portfolio has standard deviation of 20%. How does portfolio beta and residual risk change as the portfolio gets more and more stocks?
Diversification Portfolio std deviation • Number of stocks
Observation 2 Total variance vs. beta risk Two assets can have the same total variance, but much different β’s. Investors should care only about systematic, beta, risk. var(Ri) = β2 var(RM) + var(εi) • Which stock is riskier? Stock 1: std(R1) = 0.40, β = 0.5 Stock 2: std(R2) = 0.40, β = 1.5
Observation 3 Assets can have negative risk! • A stock’s β is less than 0 if the stock is negatively correlated with the market portfolio. If the market goes down, it goes up. • Such a stock contributes negatively to portfolio risk. The stock is better than riskfree! • Examples • Various derivative securities; return from a short sale of stock
Observation 4 Tangency portfolio • The CAPM implies that the market portfolio should be the tangency portfolio. • The market portfolio will have the highest risk-return trade-off (or Sharpe ratio) of any possible portfolio. • You cannot gain by stock-picking. • Competition among investors ensures that stock prices are efficient; the only way to earn a higher rate of return is to take more risk. • Portfolio advice • Buy an index fund (like Vangaurd 500)