Download
1 / 1
10 likes | 112 Views
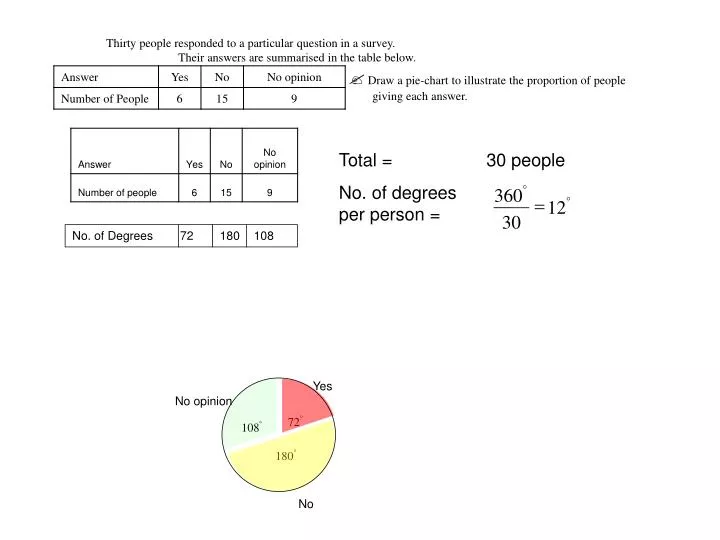
o. o. o. 108. 180. 72. Draw a pie-chart to illustrate the proportion of people giving each answer. Thirty people responded to a particular question in a survey. Their answers are summarised in the table below. Total = No. of degrees per person =.

E N D
o o o 108 180 72 Draw a pie-chart to illustrate the proportion of people giving each answer. Thirty people responded to a particular question in a survey. Their answers are summarised in the table below. Total = No. of degrees per person = 30 people o 360 o = 12 30 No. of Degrees 72 180 108 Yes No opinion No