Download
1 / 39
390 likes | 597 Views
Simulating Two-way Interactive Vegetation-Biophysical Processes and Atmospheric-Mesoscale Circulations During 2001 Santarem Field Campaign Using SiB-RAMS Model. Lixin Lu 1,2 , Scott Denning 1 , Ian Baker 1 , Marek Uliasz 1. 1 Department of Atmospheric Science, Colorado State University,

E N D
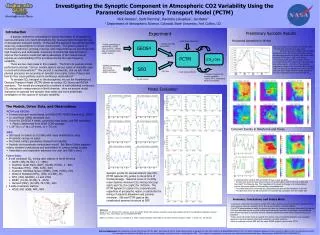
Simulating Two-way Interactive Vegetation-Biophysical Processes and Atmospheric-Mesoscale Circulations During 2001 Santarem Field Campaign Using SiB-RAMS Model Lixin Lu1,2, Scott Denning1, Ian Baker1, Marek Uliasz1 1 Department of Atmospheric Science, Colorado State University, Fort Collins, CO; and 2 ATOC/CIRES, University of Colorado, Boulder, CO Collaborators: Marcos Longo, Maria A. da Silva-Dias, Pedro da Silva-Dias, Saulo Freitas
Amazon Carbon Balance • Tropical plays an important role in global carbon budget • Flux towers in “end-member” ecosystems (intact forest, selective logging, pasture site) measure local fluxes and help understand processes controlling them • Models can be tested against flux towers, and extrapolated to regional scales using remote sensing and other spatial data products • Regional up scaling and inverse modeling need to consider the unique “tower meteorology”
Objectives Our numerical experiments aim to: • Evaluate SiBRAMS simulated surface fluxes against eddy flux tower observations. • Understand the mesoscale circulation patterns in Satarem region, and how they affect the regional carbon balance. • Investigate the potential impact of river CO2 effluxes on regional carbon balance.
1 2 4 3 Numerical Experiment Design • MODEL: SiBRAMS, Prognostic vegetation CO2 fluxes 3-D CO2 transport; Freitas (2000) • CONTROL EXPERIMENT: No river water CO2 effluxes; Sfc water CO2 flux = 5 μ mol m-2 s-1 • MODELED PERIOD: START: Aug 1, 2001 STOP: Aug 15, 2001 • BOUNDARY FORCING: CPTEC Analysis • GRID MESH: 4-level nested grids Coarsest: 100 km Finest: 1 km
August 2001 Synoptic Situation Horizontal wind at 500 mb
August 2001 Synoptic Situation Observed accumulated precipitation 1 through 15 August 2001 from automatic weather stations located in western Para • Equivalent potential temperature from CPTEC analysis, at longitudi- • nal cross section of 54.375W, and 700 mb level. The line corresponds • to Santarem region. • 3-4 days easterly wave oscillation
Aircraft Measured CO2 at 300 m River Forest Time • CO2 concentration measured by a continuous analyzer flown at 300 m elevation over the Amazon River (blue) and adjacent forest (green) on the morning of August 13. Two legs of over 100 km each were flown, one over the forest, and the other over the River. • Concentrations over the river were elevated by more than 10 ppm. • Turbulent variations of [CO2] were much greater over the forest.
Differences in Domain-averaged [CO2] • Strong diurnal cycle relate to CO2 uptake at the sfc and PBL meteorology • More impact during night • Strong PBL mixing during the day reduce the signal of the river CO2 efflux • Accumulation during night eludes tower observation due to calm condition and drainage flow
[CO2] Distribution Averaged Over Entire Simulation With River CO2 Effluxes Without Differences • Increase Northwest-Southeast [CO2] gradient • More of impact downwind (lee of the river) • Drainage flows facilitate the accumulation of [CO2] at lowlands • River CO2 efflux altered [CO2] distribution pattern
Domain-averaged, Vegetated Sfc CO2 Flux • Strong diurnal cycle relate to CO2 uptake at the sfc • More impact during day when photosynthetic uptake in progress • Increased regional vegetation uptake of carbon. • Net effect of river CO2 effluxes on regional carbon balance increase carbon source. • Amazon continue to be a carbon sink after the river CO2 effluxes are accounted for.
River CO2 Efflux on Regional Carbon Budget • Area: River=27.1024%; Land=72.8967% • River CO2 effluxes = 5 umol/m2/s • Vegetated SFC: With River CO2 effluxes: -2.19287 umol/m2/s Without River CO2 effluxes: -2.12198 umol/m2/s • Land and water: With River CO2 effluxes: -0.8378 umol/m2/s Without River CO2 effluxes: -2.12198 umol/m2/s
Low-Level Convergence (LLC) • Low-level cumulus clouds appear persistently in the study area, and seem to favor the east bank of Tapajos River. • This cloud band is frequently observed both locally and in satellite imagery. • Previous research has stressed the role of the thermally driven “river breeze” effect (Silva Dias et al, 2003). • The asymmetry and persistence of LLC under strong trade wind conditions suggests that other mechanisms may be involved
Simulated Low-Level Convergence 8/1/2001, 10AM 8/3/2001, Noon 8/6/2001, 6 PM • Elevated topography block the easterly trade • Sfc roughness length differences between water and land • Channel the wind from Amazon to Tapajos River—northerly flow • Slow down of sfc wind – convergence
Possible Mechanisms Wind Vector Amazon River Wind Vector Elevated Topography Tapajos River Tapajos River Why is the low-level cumulus cloud often better organized on the east bank of the Tapajos River? These mechanically forced updrafts lead to increased cumulus clouds and sometimes precipitation.
Tower Observations Confirm Cloud Passing • Mid-day NEE dip frequently observed • Nearly constant Bowen ratio at mid-day indicates cloud effects rather than water stress • The timing of simulated maximum surface convergences relate to the mid-day cloud passing • Observed net radiation from an nearby met station confirms the existence of midday cloudiness
Lagrangian Particle Model Coupled With SiB-RAMS • Transect of ten 60-m towers every 4 km X = 143, 147, …, 171, 179 km, Y = -62 km • Virtual tower #8 corresponds to KM67 location • 18,000 particles/hour at each tower, tracked backward in time; influence function was calculated for hourly concentration sampling at each tower • Time series of [CO2] coming to each tower from sfc fluxes (veg. photosynthesis and respiration, river CO2 efflux) within radius of 100-km • 24 hour composite from 13 days • Red line / Yellow - [CO2] at a tower • Blue - fraction of [CO2] coming from water
Contribution of [CO2] Sources X=143km Y=-62km
Contribution of [CO2] Sources X=147km Y=-62km
Contribution of [CO2] Sources X=151km Y=-62km
Contribution of [CO2] Sources X=155km Y=-62km
Contribution of [CO2] Sources X=159km Y=-62km
Contribution of [CO2] Sources X=163km Y=-62km
Contribution of [CO2] Sources X=167km Y=-62km
Contribution of [CO2] Sources X=171km Y=-62km Location: Km 67 Yellow: vegetation; Blue: water CO2 efflux
Contribution of [CO2] Sources X=175km Y=-62km
Contribution of [CO2] Sources X=179km Y=-62km
Summary and Conclusion • Mesoscale simulation of the SMC reproduces many aspects of the observed fluxes and [CO2] • Topographic distribution, landscape feature, and heterogeneous vegetation produce easily detectable spatial structure in simulated CO2 • River CO2 efflux enhance vegetation carbon uptake, and modifies regional carbon budget • River CO2 efflux modifies [CO2] concentration distribution, especially at night • Low-level convergence is simulated on many days along the east bank of the Tapajos River during strong, steady Trade Winds • Cumulus clouds associated with this convergence line are frequently observed by satellite imagery, and flux measurements often indicate reduced NEE due to resulting cloud shading • The mechanical forcings are likely the dominant factors to form LLC,while thermal forcing can be secondary during steady trade winds • Particle model can be used to quantify different sources of [CO2], and their contribution to tower-observed [CO2] • Flux tower data interpretation must consider LLC effects
Publications in Progress • Mesoscale circulations and atmospheric CO2 variations in the Tapajos Region, Para, Brazil. JGR-Atmosphere, 110, D21102, doi: 10.1029/2004JD005757. • Lu, L., et al. 2008: Simulating the two-way interactions between vegetation biophysical processes and mesoscale circulations during 2001 Santarem field campaign. JGR. To be submitted. • The potential influence of river CO2 efflux on regional carbon balance in the Tapajos region, Para, Brazil. GRL. In preparation. • Why the low-level cumulus clouds are often better organized on the east-side of Tapajos River – A mechanistic study. JAS. In Preparation.
Acknowledgments • We acknowledge NASA LBA-Ecology Grant, NCC5-707, for support of our research. • We thank Prof. Steven Wofsy, for his support of using KM 67 tower data for our analysis.
Additional Figures NDVI distribution