Download
1 / 1
10 likes | 188 Views
METHODS. RESULTS. Introduction. ACKNOWLEDGEMENTS. CONCLUSIONS. Uncertainty analysis of carbon turnover time and sequestration potential in terrestrial ecosystems of the Conterminous USA. Xuhui Zhou 1 , Tao Zhou 1 , Yiqi Lu o 1

E N D
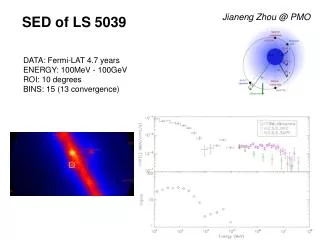
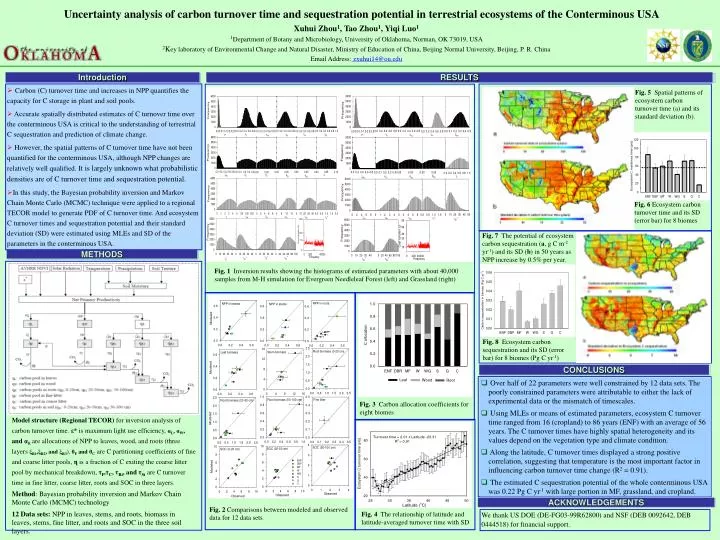
METHODS RESULTS Introduction ACKNOWLEDGEMENTS CONCLUSIONS Uncertainty analysis of carbon turnover time and sequestration potential in terrestrial ecosystems of the Conterminous USA Xuhui Zhou1, Tao Zhou1, Yiqi Luo1 1Department of Botany and Microbiology, University of Oklahoma, Norman, OK 73019, USA 2Key laboratory of Environmental Change and Natural Disaster, Ministry of Education of China, Beijing Normal University, Beijing, P. R. China Email Address:zxuhui14@ou.edu • Carbon (C) turnover time and increases in NPP quantifies the capacity for C storage in plant and soil pools. • Accurate spatially distributed estimates of C turnover time over the conterminous USA is critical to the understanding of terrestrial C sequestration and prediction of climate change. • However, the spatial patterns of C turnover time have not been quantified for the conterminous USA, although NPP changes are relatively well qualified. It is largely unknown what probabilistic densities are of C turnover time and sequestration potential. • In this study, the Bayesian probability inversion and Markov Chain Monte Carlo (MCMC) technique were applied to a regional TECOR model to generate PDF of C turnover time. And ecosystem C turnover times and sequestration potential and their standard deviation (SD) were estimated using MLEs and SD of the parameters in the conterminous USA. Fig. 5 Spatial patterns of ecosystem carbon turnover time (a) and its standard deviation (b). Fig. 6 Ecosystem carbon turnover time and its SD (error bar) for 8 biomes Fig. 7 The potential of ecosystem carbon sequestration (a, g C m-2 yr-1) and its SD (b) in 50 years as NPP increase by 0.5% per year. Fig. 1 Inversion results showing the histograms of estimated parameters with about 40,000 samples from M-H simulation for Evergreen Needleleaf Forest (left) and Grassland (right) Fig. 8 Ecosystem carbon sequestration and its SD (error bar) for 8 biomes (Pg C yr-1) • Over half of 22 parameters were well constrained by 12 data sets. The poorly constrained parameters were attributable to either the lack of experimental data or the mismatch of timescales. • Using MLEs or means of estimated parameters, ecosystem C turnover time ranged from 16 (cropland) to 86 years (ENF) with an average of 56 years. The C turnover times have highly spatial heterogeneity and its values depend on the vegetation type and climate condition. • Along the latitude, C turnover times displayed a strong positive correlation, suggesting that temperature is the most important factor in influencing carbon turnover time change (R2 = 0.91). • The estimated C sequestration potential of the whole conterminous USA was 0.22 Pg C yr-1 with large portion in MF, grassland, and cropland. Fig. 3 Carbon allocation coefficients for eight biomes Model structure (Regional TECOR) for inversion analysis of carbon turnover time. ε* is maximum light use efficiency, αL, αW, and αRare allocations of NPP to leaves, wood, and roots (three layers ξR1,ξR2, and ξR3), θF and θC are C partitioning coefficients of fine and coarse litter pools, ηis a fraction of C exiting the coarse litter pool by mechanical breakdown, τF,τC, τRi, and τSiare C turnover time in fine litter, coarse litter, roots and SOC in three layers. Method: Bayesian probability inversion and Markov Chain Monte Carlo (MCMC) technology Fig. 2 Comparisons between modeled and observed data for 12 data sets. 12 Data sets: NPP in leaves, stems, and roots, biomass in leaves, stems, fine litter, and roots and SOC in the three soil layers. Fig. 4 The relationship of latitude and latitude-averaged turnover time with SD We thank US DOE (DE-FG03-99R62800) and NSF (DEB 0092642, DEB 0444518) for financial support.