Download
1 / 61
630 likes | 794 Views
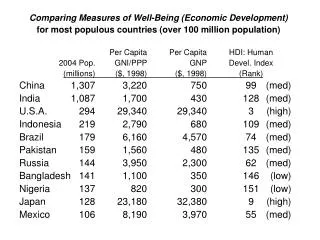
Measures of Development. Human Development Index. recognizes a country’s development level as a function of economics (GDP per capita), social (literacy rate & level of education), and demographic factors (life expectancy) Highest possible rank is 1.0. Economic Indicator.

E N D
Human Development Index • recognizes a country’s development level as a function of • economics (GDP per capita), • social (literacy rate & level of education), and • demographic factors (life expectancy) • Highest possible rank is 1.0
Economic Indicator • GDP per capita: the value of the total output of goods and services produced in a country in a normal year divided by total population
GDP per Capita • European countries have the highest per capita GDP because of high GDP and low population. • Luxembourg – $79,000 • Norway - $53,300 • Africa the lowest per capita GDP due to low GDP and high population • Zimbabwe - $300 • DRC - $350
GDP • Which countries have high GDP? • Which countries have low GDP? (don’t just pick the easy ones you know) • What is Luxembourg’s category of GDP? Which other countries are in the same category? • Explain how the Western European country of Luxembourg has this level of GDP.
GDP • Throughout this presentation – pay attention to Brazil, Russia, China, India, and South Africa. • Let me explain when I say • Rule of Thumb – what is generally happening in the area • Weird exception – in an area everything is generally one way except this one country is noticeably different • For example – on the next slide the rule of thumb is Sub-Saharan Africa has a low GDP per capita, the weird exception is South Africa & Botswana
GDP per Capita • Check Luxembourg – Is your explanation still valid? • Check B, R, I, C, and SA • Which regions have high GDP per capita? Any weird exceptions? • Which regions have low GDP per capita? Any weird exceptions? • Can you see the core, semi-periphery, and periphery pattern?
What is the correlation of landlocked states and low GDP per capita? Weird exceptions?
What is the correlation of gov’t type and low GDP per capita? Source: Matthew White, 2003. http://users.erols.com/mwhite28/othergov.htm Adapted from FreedomHouse.org
Another map of government type http://chartsbin.com/view/6kx
Correlation means when something happens then the other things happens to – • The left side of the x-axis means the government is very corrupt • Does HDI correlate government corruption? • What is the relationship between government corruption and economic development?
Social Indicators • Literacy rate – the percentage of a country’s people who can read and write. • Literacy rates exceed 98% in MDCs • Amount of education – measured by taking the average number of years a student attends school in a country.
Literacy Rate • Check B, R, I, C, and SA – anything unusual • Which regions are high? Weird exceptions? • Which regions are low? Weird exceptions? • Why do the former Soviet countries, which is semi-periphery, have a high literacy rate
Years in School • Check B, R, I, C, and SA – anything unusual? • Which regions are high? Weird exceptions? • Which regions are low? Weird exceptions?
Compare – any significant differences? • Do you see core, semi-periphery, and periphery?
Demographic Indicators • Life expectancy • This is the average age of death for the citizenry • Because of better healthcare, people in MDCs tend to live 10-13 years longer than in LDCs.
Life Expectancy • Do you see core, semi-periphery, and periphery? • Check B, R, I, C • Pay particular attention to South Africa – Why?
Make a Prediction • Which regions have a high HDI? • Low HDI?
HDI • Do you see core, semi-periphery, and periphery? • Check B, R, I, C and SA
Physicians /1,000 persons • Why do the former Soviet countries have so many physicians?
Natural Increase rate • Rate at which the population increases • Around 1.5% in LDCs and .1% in MDCs • This causes social strain due to increased social cost. • Crude Birth rate • Rate at which children are being born into the population • LDCs face a rate around 24 per 1000 while MDCs are around 11 per 1,000 • Because LDCs death rate is 8 per 1000 this leads to an enormous increase in population
Other Economic Indicators • Sectors of the Economy • Productivity • Raw Materials • Consumer goods
Sectors of the Economy • Primary –lowest sector of sophistication. Involves extracting materials directly from the earth; mining, agriculture, fishing, and forestry • Higher % of population = greater chance of poverty
Sectors of the Economy • Secondary sector – manufacturing that transforms raw materials into useful products.
Sectors of the Economy • Tertiary – occupations based on providing services; tourism, restaurants, retail, etc. • Most MDCs have the majority of their economy in this sector. • Quantenary – service based occupations that are intellectual in nature; education, library services, government, etc. • Quinary – service based occupations that involve cutting edge technology
Make a Prediction • Regions that are primarily • Primary • Secondary • Tertiary
The percentage of people working in agriculture exceeds 75% in many LDC’s of Africa and Asia. In Anglo-America and Western Europe the figure is <5% Primary Products
Industrial Sector • The way to read this map – shown larger on the next slide • The country with the highest secondary sector output, Merica, is set to 100%. • The other countries production is given as a percentage of what the USA is producing. • So USA is producing $2.5 trillion, then Japan is producing 50% or $1.25 trillion. • Ditto for the Service slide
Productivity • Value of a product in comparison to the labor needed to make it. • It is measured by assessing the value added per worker • Value added is the gross value of the product minus the costs of raw materials and energy • US has a value added of $80,000 in comparison to countries such as India at $500
Productivity • MDCs - produce more because of access to technology, tools, and equipment. • Money earned is reinvested into new technology increasing overall output. • LDCs - rely on animal and human power resulting in less production
Raw Materials • Necessary for production • Ex. United States and Russia - rapid industrial development due to an enormous amount of available resources. • Ex. United Kingdom have had to establish colonies to replace depleted resources • Ex. Botswana, Namibia, South Africa – DeBeers Diamonds (founded by Cecil Rhodes)
Raw Materials • Other countries have lots of resources but foreign private industries are responsible for mining (Diamonds in South Africa).