Download
1 / 1
10 likes | 85 Views
Comparing Measures of Well-Being (Economic Development) for most populous countries (over 100 million population) Per Capita Per Capita HDI: Human 2004 Pop. GNI/PPP GNP Devel. Index (millions) ($, 1998) ($, 1998) (Rank) China 1,307 3,220 750 99 (med) India 1,087 1,700 430 128 (med)

E N D
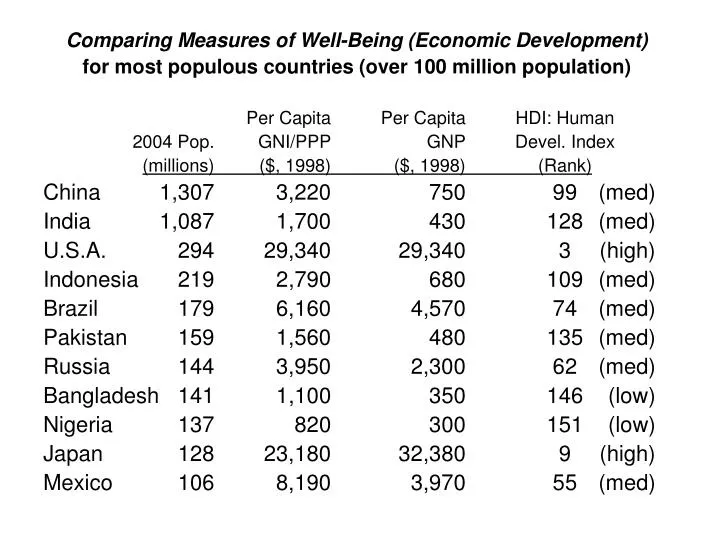
Comparing Measures of Well-Being (Economic Development) for most populous countries (over 100 million population) Per Capita Per Capita HDI: Human 2004 Pop. GNI/PPP GNP Devel. Index (millions) ($, 1998) ($, 1998) (Rank) China 1,307 3,220 750 99 (med) India 1,087 1,700 430 128 (med) U.S.A. 294 29,340 29,340 3 (high) Indonesia 219 2,790 680 109 (med) Brazil 179 6,160 4,570 74 (med) Pakistan 159 1,560 480 135 (med) Russia 144 3,950 2,300 62 (med) Bangladesh 141 1,100 350 146 (low) Nigeria 137 820 300 151 (low) Japan 128 23,180 32,380 9 (high) Mexico 106 8,190 3,970 55 (med)