Download

1 / 5

E N D
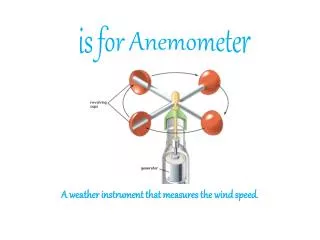
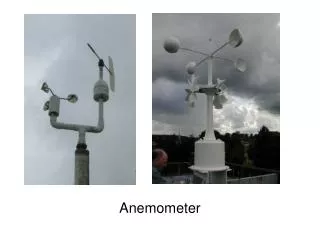
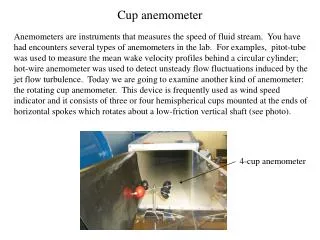
Cup anemometer Anemometers are instruments that measures the speed of fluid stream. You have had encounters several types of anemometers in the lab. For examples, pitot-tube was used to measure the mean wake velocity profiles behind a circular cylinder; hot-wire anemometer was used to detect unsteady flow fluctuations induced by the jet flow turbulence. Today we are going to examine another kind of anemometer: the rotating cup anemometer. This device is frequently used as wind speed indicator and it consists of three or four hemispherical cups mounted at the ends of horizontal spokes which rotates about a low-friction vertical shaft (see photo). 4-cup anemometer
Cup anemometer As the anemometer is placed inside the flow stream, the concave surfaces of the cups have higher wind resistance than their convex counterparts. Consequently, this produces an unbalanced moment with respect to the center axis and forces the cups to rotate (see schematic). Under steady flow condition, the rotational speed of the anemometer is directly related to the wind speed, that is: V=f(w). We are going to theoretically determine this functional dependence and compared the result to experimental data. Drag coefficient: CDV frontal area Af w:angular velocity V Radius: R=0.075 m Drag coefficient: CDC
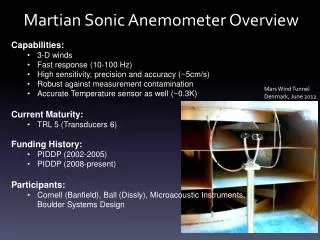
Cup anemometer Theoretical derivation: Assume that only the two cups that are directly facing the incoming flow stream contribute to the unbalanced moment. Also assume frictional torque is negligible. (a) Determine the unbalanced torque acting on the central shaft as a function of the rotational speed of the anemometer, w. (b) In order to reach a steady rotational speed, the torque should be equal to zero. Based on this understanding, determine the wind speed V as a function of the rotational speed (w), the radius (R), and the drag coefficient ratio (a=CDC/CDV). (Drag coefficients for selected objects can be read from table 9.3 in the textbook) Plot V as a function of w for the given condition. Hint: the apparent wind speeds experienced by the rotating hemispherical cups should be the relative velocities between the cups and the incoming flow. Experimental verification: (1) A corresponding experiment was carried out in the wind tunnel to check the validity of the previous theoretical model. The cup anemometer was placed in the center of the test section as shown in the earlier photo.
Cup anemometer (2) The rotational speeds (w) of the cup anemometer were recorded for corresponding wind speeds (V) following these procedures: (2-A) The speed of the wind tunnel (V) was calculated using the following formula: V = 0.06424*(counter reading) - 4.652, where the counter reading is an indicator representing the rotational speed of the fan that drives the wind tunnel. (2-B) The rotational speed of the anemometer (w=2pfa) was determined by using an electronic stroboscope. If the periodic flashing frequency (fS) of the strobe matched or was a multiple of the rotational frequency of the anemometer (fS=Nfa, N is an integer), the rotating cups would appear stationary to an observer in the dark. The rotational speed of the anemometer can be determined easily using this technique. (2-C) The corresponding data set was included in the Excel data file anemometer.xls. (3) Plot the experimental data on the same graph as the theoretical prediction V=f(w). Compare the results and discuss.
Solution For the present case: CD,C=1.42, CD,V=0.38 (Table 9.3) a=1.933