Download
1 / 14
140 likes | 257 Views
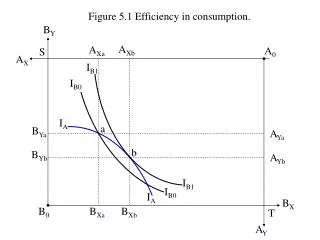
Figure 5.1 Efficiency in consumption. B Y. A Xb. A Xa. A 0. S. A X. I B1. I B0. I A. a. B Ya. A Ya. b. B Yb. A Yb. I B1. I B0. I A. B X. B 0. B Xa. B Xb. T. A Y. Figure 5.2 Efficiency in production. K Y. L Xb. L Xa. X 0. L X. I Y1. I Y0. I X. a. K Ya. K Xa. b.

E N D
Figure 5.1 Efficiency in consumption. BY AXb AXa A0 S AX IB1 IB0 IA a . BYa AYa b BYb . AYb IB1 IB0 IA BX B0 BXa BXb T AY
Figure 5.2 Efficiency in production. KY LXb LXa X0 LX IY1 IY0 IX a . KYa KXa b KYb . KXb IY1 IY0 IX LY Y0 LYa LYb KX
Figure 5.3 Product-mix efficiency. Y I YM a Ya b Yb c Yc I XM X 0 Xa XC Xb
Figure 5.4 The set of allocations for consumption efficiency. BY A0 S AX B A C B A B A B A B B A . A B A B A B A C A B BX B0 T AY
Figure 5.5 The utility possibility frontier. UB T Z S R UA 0
Figure 5.6 Maximised social welfare. UB W a b c W UA 0
Figure 5.7 Welfare and efficiency. UB D E C W2 W1 UA 0
Figure 5.8 Utility maximisation. Y Ymax U* a b Y* U* c X 0 X* Xmax
Figure 5.9 Cost minimisation. Y K3 X* K2 a K1 b c X* L 0 L3 L1 L2
Figure 5.10 Profit maximisation. P, c Marginal cost PX X 0 X*
Figure 5.12 The efficient level of supply for a public good. £ MRUSA + MRUSB = MWTPA + MWTPB MC = MRT MRUSB = MWTPB MRUSA = MWTPA X X*
Figure 5.13 The bargaining solution to an externality. £ MB MEC a c b d Hours of music 0 M* M0
Figure 5.14 Taxation for externality correction. £ SMC PMCT PMC PY t Y 0 Y* Y0
Figure 5.15 The polluting monopolist. £ DY SMC PYt e f PY0 PMC b a c DY d MRY Y 0 Y0 Y* Yt Yc