Download
1 / 40
400 likes | 488 Views
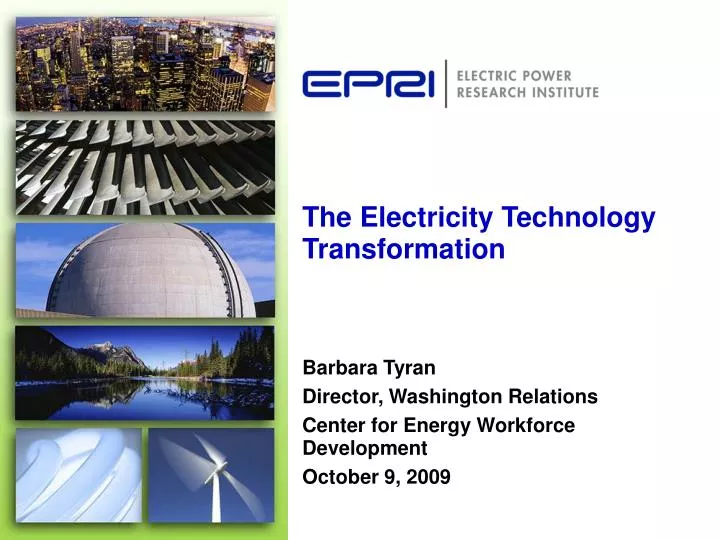
The Electricity Technology Transformation. Barbara Tyran Director, Washington Relations Center for Energy Workforce Development October 9, 2009. Our Mission…. To conduct research on key issues facing the electricity sector…on behalf of its members, energy stakeholders, and society.

E N D
The Electricity Technology Transformation Barbara Tyran Director, Washington Relations Center for Energy Workforce Development October 9, 2009
Our Mission… To conduct research onkey issues facing the electricity sector…on behalf of its members, energy stakeholders, and society.
Our Members… • 450+ participants in more than 40 countries • EPRI members generate more than 90% of the electricity in the United States • International funding of more than 15% of EPRI’s research, development and demonstrations • Programs funded by more than 1,000 energy organizations
Our Role… Help Move Technologies to the Commercialization Stage… Basic Research and Development Collaborative Technology Development Integration Application Technology Commercialization National Laboratories Universities EPRI Suppliers Vendors Technology Accelerator!
Presentation Overview • The Technology Challenge De-carbonize the electricity infrastructure and meet binding economy-wide CO2 reduction targets Provide reliable, affordable, and environmentally responsible electricity
The Technology Challenge 22 2050 20 18 16 14 12 Wholesale Electricity Cost (2007 cents/kWh) 10 Cost of Electricity 2020 2007 8 6 4 2 0 0.70 0.60 0.50 0.40 0.30 0.20 0.10 0.00 Emissions Intensity (metric tons CO2 /MWh) De-Carbonization
Presentation Overview • The Technology Challenge • Meeting The Challenge De-carbonize the electricity infrastructure and meet binding economy-wide CO2 reduction targets Provide reliable, affordable, and environmentally responsible electricity Technically feasible with a full portfolio of generation options Decisions Over the Next Decade will Shape the Electricity Future of 2050
8 Assumed Economy-wide CO2 Reduction Target 7 2005 = 5982 mmT CO2 6 2012 = 3% below 2005 (5803 mmT CO2) 2020 = 17% below 2005 (4965 mmT CO2) 5 2030 = 42% below 2005 (3470 mmT CO2) 4 3 2050 = 83% below 2005 (1017 mmT CO2) 2 83% Reduction in CO2 emissions from 2005 1 0 1990 2000 2010 2020 2030 2040 2050 The CO2 Challenge Historical Emissions Remainder of U.S. Economy Billion tons CO2 U.S. Electric Sector
18 16 14 12 10 8 6 4 2 0 1950 1960 1970 1980 1990 2000 2010 The Cost Challenge U.S. Retail Price of Electricity Cents/kWh (in 2007 cents) Flat real electricity prices for past 40 years… what about the next 40 years?
The Electricity Technology Challenge • The Technology Challenge • Meeting the Challenge
3500 2007 3000 2008 2500 2000 1500 1000 500 0 1990 1995 2000 2005 2010 2015 2020 2025 2030 U. S. Electric Sector CO2 Emissions EIA Base Case 2009 U.S. Electric Sector CO2 Emissions(million metric tons)
3500 3000 2500 2000 1500 1000 500 0 1990 1995 2000 2005 2010 2015 2020 2025 2030 2009 Prism 41% reduction in 2030 from 2005 level is technically feasible using a full portfolio of electric sector technologies Efficiency Renewables Nuclear Fossil Efficiency U.S. Electric Sector CO2 Emissions(million metric tons) CCS 41%
3500 3000 2500 2000 1500 1000 500 0 1990 1995 2000 2005 2010 2015 2020 2025 2030 2009 Prism – PEV and Electro-Technologies Low-carbon generation enables electrification and CO2 reductions in other sectors of economy Efficiency Renewables Nuclear Fossil Efficiency U.S. Electric Sector CO2 Emissions(million metric tons) CCS PEV Electro-Technologies
15% 28% 6% 10% 28% 11% 2% Generation by Fuel Source in 2030 Coal 7% Renw Coal CCS What if we LIMIT the Generation PORTFOLIO? 6% Renw Petroleum Gas Coal Gas CCS 19% Nuclear 50% Nuclear Nuclear Coal C+CCS Hydro Gas Renewables Gas 17% 1% Prism 20304888 TWh EIA 20304669 TWh Prism 60% no- or low-carbon electricity by 2030
Technology Portfolios • Full Portfolio • Coal and Gas CCS available • Accelerated end-use efficiency • PEV’s can expand • Nuclear production can expand • Limited Portfolio • No CO2 capture and storage (CCS) • No plug-in electric vehicles (PEV’s) • Nuclear generation remains at existing levels
MERGE Economic Model • Optimization Model of Economic Activity and Energy Use through 2050 • Maximize Economic Wealth • Inputs • Energy Supply Technologies and Costs for Electric Generation and Non-Electric Energy • Constraints • Greenhouse Gas Control Scenarios • Energy Resources • Outputs • Economy-wide Impact of Technology and Carbon Constraints
MERGE U.S. Electric Generation Mix Aggressive Energy Efficiency Needed with Either Portfolio Limited Portfolio Full Portfolio Demand Reduction Demand Reduction Biomass Wind Solar Hydro Biomass Wind 52% Increase in Demand Reduction with Limited Portfolio Nuclear Hydro Nuclear Gas Generation Mix Generation Mix Gas Coal New Coal + CCS Coal CCS Retrofit
MERGE U.S. Electric Generation Mix Limited Portfolio Full Portfolio Demand Reduction Demand Reduction Biomass Wind Solar Hydro Biomass Wind Nuclear Hydro Nuclear Gas Gas Coal New Coal + CCS Coal CCS Retrofit
Insights - Renewables Limited Portfolio Full Portfolio Demand Reduction Demand Reduction Biomass Wind Solar Hydro Biomass Wind Nuclear Hydro Nuclear Gas > 20% Renewables by 2030 with Either Portfolio > 50% Renewables by 2050 with Limited Portfolio Gas Coal New Coal + CCS Coal CCS Retrofit
Gas Expands Rapidly 2010-2020 if Uncertainty Exists Regarding Availability of New Nuclear and CCS post 2020 Insights – Nuclear and CCS Limited Portfolio Full Portfolio Demand Reduction Demand Reduction Limited Portfolio – Gas Consumption Increases 275% from 2010 to 2050 Biomass Wind Solar Hydro Biomass Wind Nuclear Hydro Nuclear Gas Gas Coal New Coal + CCS Coal CCS Retrofit
Biomass Biomass Coal Coal CCS Retrofit Wind Wind Coal + CCS Gas Hydro Gas Hydro Nuclear Nuclear 2030 Generation Mix Remarkably different futures…and only 20 years away! Limited Portfolio Full Portfolio
Biomass Solar Wind Gas Coal + CCS Biomass Hydro Nuclear Nuclear Wind Hydro Gas 2050 Generation Mix Totally different futures in 2050 Limited Portfolio Full Portfolio
$220 $200 $180 $160 $140 $120 $100 $80 $60 $40 $20 $0 MERGE Wholesale Electricity Cost Results Substantial increases in the cost of electricity Limited Portfolio 2050 Limited Portfolio Full Portfolio 210% $/Mwh (2007$) Full Portfolio 80% 2007 U.S. Average Wholesale Electricity Cost 2007 U.S. Average Wholesale Electricity Cost 2020 2030 2040 2050
2050 MERGE Projections 2020-2050 Limited Portfolio 2040 2040 2030 2050 2020 2030 2020 Full Portfolio MERGE De-carbonization Results 22 2050 20 18 16 14 12 Wholesale Electricity Cost (2007 cents/kWh) 10 Cost of Electricity 2020 2007 8 6 4 2 0 0.70 0.60 0.50 0.40 0.30 0.20 0.10 0.00 Emissions Intensity (metric tons CO2 /MWh) De-Carbonization
MERGE De-carbonization Results 22 2050 MERGE Projections 2020-2050 2050 20 Limited Portfolio Limited Portfolio High Cost to meet 2050 Reduction Target with >80% Generation Mix Gas and Renewables 18 16 2040 2040 14 2040 2030 2040 12 2030 2050 2050 2020 Wholesale Electricity Cost (2007 cents/kWh) 2020 Full Portfolio 10 Cost of Electricity 2030 2030 2020 2020 Full Portfolio 2007 8 6 4 2 0 0.70 0.60 0.50 0.40 0.30 0.20 0.10 0.00 Emissions Intensity (metric tons CO2 /MWh) De-Carbonization
The Electricity Technology Challenge • The Technology Challenge • Meeting the Challenge
$220 $200 $180 Technology Actions Based on Meeting the Prism Technology Targets RD&D and Deployment Challenge $160 $140 $120 Technology Innovation to De-carbonize While Achieving a Cost of Electricity Near Today’s Level $100 Innovation Challenge $80 $60 $40 $20 $0 Meeting the Challenge Limited Portfolio Limited Portfolio Full Portfolio $/Mwh (2007$) Full Portfolio 2007 U.S. Average Wholesale Electricity Cost 2007 U.S. Average Wholesale Electricity Cost 2020 2030 2040 2050
Power Delivery & Utilization: energy demand is increasing… • 2008 Annual Energy Outlook - • 30% increase in U.S. electricity consumption by 2030. • New load equivalent to 2006 electricity usage in California, Texas, Florida, Ohio and Pennsylvaniacombined!
Bringing it home…Consumer Electronics PLASMA TV SET TOP BOX 42”250W 30W = vs. 27”100W 30W 2 set top boxes consume as much energy in one year as a refrigerator Consumes 2.5x more energy
Bringing the picture into focus… 250 MW Power Plants* *250 MW plant can serve 160,000 full homes Digital Photo Frames 1 per U.S. home…
Smart Grid State of the technology… • We are in the infancy in developing a smart grid • Smart grid can mean different things to different utilities • No standards for inclusive technologies • Smart capabilities vary from utility to utility
Smart Grid Where we want to be… • Smart power delivery infrastructure encompassing physical power, storage, advanced information technology and intelligent sensors and applications • Numerous impacts • Reliable grid operations when connecting to renewable resources • Dynamic grid adjustment to reduce losses and increase efficiency • On-line assessment to minimize reliability events
IntelliGrid Identifying a smart grid and how to create it… • Methodology, technology tools, and standards recommendations • Information systems to support smart grid applications • Unbiased testing of technologies and products • Development of communications architecture that will enable interoperability
Smart Grids andLocal Energy Networks Efficient Building Systems Utility Communications Internet Renewables PV Consumer Portal & Building EMS Advanced Metering Control Interface Distribution Operations Dynamic Systems Control Plug-In Hybrids Smart End-Use Devices Distributed Generation & Storage Data Management
Smart Gridsand Local Energy Networks Efficient Building Systems Utility Communications Internet Renewables PV Consumer Portal & Building EMS Advanced Metering Control Interface Distribution Operations Dynamic Systems Control Plug-In Hybrids Smart End-Use Devices Distributed Generation & Storage Data Management
Electric Transportation State of the technology… • PHEV technology is ready now • Hybrids remain dependent on combustible fuels • Existing challenges remain for fully electric vehicles • All electric PHEV 40 mile range could meet the transportation requirements for 80% of vehicles • Widespread adoption of PHEVs can reduce GHG emissions by 2050 the equivalent to removing 82.5 million passenger cars from the road
Action Framework… Four Evolving Infrastructures Creating the Electricity Network of the Future
Conclusion 22 2050 MERGE Projections 2020-2050 Electricity policy and technology actions over the next decade will to a great extent shape the electricity future of 2050 2050 20 Limited Portfolio Limited Portfolio 18 16 2040 2040 14 2040 2030 2040 12 2030 2050 2050 2020 Wholesale Electricity Cost (2007 cents/kWh) 2020 Full Portfolio 10 Cost of Electricity 2030 2030 2020 2020 Full Portfolio 2007 8 6 Which Future Are You Creating? 4 2 0 0.70 0.60 0.50 0.40 0.30 0.20 0.10 0.00 Emissions Intensity (metric tons CO2 /MWh) De-Carbonization