Download
1 / 17
170 likes | 262 Views
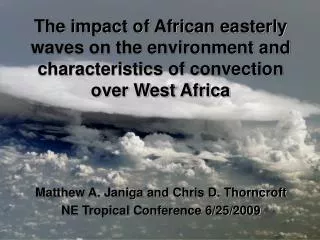
The impact of African easterly waves on the environment and characteristics of convection over West Africa. Matthew A. Janiga and Chris D. Thorncroft University at Albany 3 rd AMMA Conference 7/24/2009. Objectives.

E N D
The impact of African easterly waves on the environment and characteristics of convection over West Africa Matthew A. Janiga and Chris D. Thorncroft University at Albany 3rd AMMA Conference 7/24/2009
Objectives • We composited mesoscale convective system genesis locations, reanalysis data, and radiosonde data onto objectively tracked African easterly waves (AEWs). • We will address the question why does convection develop where it does within an AEW? Introduction| Methods | Convection| Reanalysis | Radiosonde | Summary
Review – Distribution of Convection • Distribution of convection and it’s lifecycle… • Enhanced cloud cluster genesis ahead of trough. • Enhanced decay behind the trough and in the ridge. • The greatest rainfall is ahead of the trough. • Fink and Reiner (2005) suggest that there is a secondary genesis maximum in the southerlies north of 12.5°N. Cloud Cluster Genesis R N T S R Payne and McGarry (1977) Introduction| Methods | Convection| Reanalysis | Radiosonde | Summary
Review – Structure of the AEW Deep Convection • Low-level adiabatic forcing for ascent ahead of the trough and descent behind the trough (small arrows). • Thorncroft and Hoskins (1990) propose that the low-level forcing ahead of the trough would trigger deep moist convection (big arrow). • There is also advection of dry air in the northerlies and moist air in the southerlies which modifies the distribution of negative area. ζ’ > 0 AEJ Trough Thorncroft and Hoskins (1990) Introduction| Methods | Convection| Reanalysis | Radiosonde | Summary
Production of AEW Tracks • ECMWF Interim Reanalysis 650 hPa PV during June-September 2004-2008 was degraded and maxima were objectively tracked. • Disturbances lasting 2 days or longer, moving at least 10° westward, and moving through the domain (7.5-17.5N, 15W-20E) were used to composite reanalysis fields, radiosonde data, and objectively tracked cloud clusters. • 291 events or 2570 AEW “snapshots.” 30N 20N 10N 0 2006/8/30 06 UTC 650 hPa PV, streamfunction, objective troughs and jet (Berry et al., 2007), and objective AEW PV maxima. AEW 1 AEW 2 AEW 4 AEW 3 30W 20W 10W 0 10E 20E 30E 40E 50E 0.5 1 1.5 2.0 2.5 3.0 3.5 4.0 4.5 5.0 Introduction| Methods | Convection| Reanalysis | Radiosonde | Summary
AEW Tracks Track density (10-2 passages day-1 2.5 degrees-1) of AEWs. 25N 20N 15N 10N 5N 0 • There is an increase in track density moving westward. • The most intense disturbances are also to the west. • The track density and mean intensity of the AEWs will make the composites weighted toward the character of west coast AEWs. 30W 15W 0 15E 30E 45E 1 2 3 4 5 6 7 8 9 10 11 12 13 14 15 Mean Intensity (0.1 PVU) of qualified AEWs. 25N 20N 15N 10N 5N 0 30W 15W 0 15E 30E 45E 1.25 1.75 2.25 2.75 3.25 3.75 4.25 Introduction| Methods | Convection| Reanalysis | Radiosonde | Summary
Production of MCS Tracks NASA Merged 10.8 μm IR 2006/8/30 6 UTC • 30min, 4km resolution IR data from JJAS 2004-2008 was used to objectively track mesoscale convective systems (MCSs). • MCSs are defined as IR clusters cooler than 233K with a minimum area of 5000km2. 233K is well correlated with the boundaries of a precipitating cloud shield. • A subset of MCSs (LL) lasting longer than 6h was produced. While they are a small percent of the number of cold cloud clusters they explain 80% of all pixels cooler than 233K in the time period. 20N 10N 0 20W 10W 0 10E 20E 30E 40E Clusters <233 K 2006/8/30 6 UTC 20N 10N 0 20W 10W 0 10E 20E 30E 40E Introduction | Methods | Convection| Reanalysis | Radiosonde | Summary
AEW Relative Long-Lived (>6 h) MCS Genesis Number of Genesis Events • Location of LL MCS genesis relative to the AEW mid-level vortex (MLV). • There is increased genesis ahead of the trough and decreased genesis in the ridge and southerlies. • Based on the composite structure of an AEW why do we see this? 16 8 0 -8 -16 Relative Latitude MLV -16 -8 0 8 16 2 10 18 26 34 42 50 Relative Longitude Introduction| Methods |Convection| Reanalysis | Radiosonde | Summary
Streamfunction and V Plan Views and Cross-Sections 650 Streamfunction and Wind 900 Streamfunction and Wind • All reanalysis composites show use 1-20 day band-pass filtered fields. • The low-levels are characterized by a low-level vortex (LLV) on the baroclinic zone and the bottom of the mid-level vortex (MLV). • The bowed wind perturbations suggest barotropic energy conversions. • The trough tilts eastward with height below the AEJ and westward above the AEJ suggesting baroclinic energy conversions. LLV Rel. Latitude Rel. Latitude MLV MLV Rel. Longitude Rel. Longitude Streamfunction and Wind (0 Lat.) Streamfunction and Wind (0 Lon.) MLV MLV Pressure Pressure LLV E W N S Rel. Longitude Rel. Latitude Stream Func. (104 m2 s-1), Wind (m s-1) Introduction| Methods | Convection| Reanalysis | Radiosonde | Summary
Q-Vector Convergence and Vertical Velocity Plan Views 800 Q-Vectors and Q-Vector Conv. 800 Pressure Vertical Velocity • Q-vector convergence of the non-divergent wind (e.g. Kiladis et al., 2006). • The structure of the MLV and LLV ascent/descent couplets in the two fields compare well. Rel. Latitude Rel. Latitude Rel. Longitude Rel. Longitude QVC (10-20 Pa-1 s-3), Q (10-14 m Pa-1 s-3) ω ( hPa-1 hr-1) Introduction | Methods | Convection| Reanalysis | Radiosonde | Summary
Q-Vector Convergence and Vertical Velocity Cross-Sections • Adiabatic forcing for ascent associated with the MLV is greatest at 800 hPa and weak above the AEJ. • While the forcing for ascent is only at low-levels moist convection results in deep ascent. Q-Vector Convergence (0 Lat.) Pressure Vertical Velocity (0 Lat.) Pressure Pressure W W E E Rel. Longitude Rel. Longitude QVC (10-20 Pa-1 s-3) Omega ( hPa-1 hr-1) Introduction | Methods | Convection| Reanalysis | Radiosonde | Summary
Specific Humidity Plan-Views and Cross-Sections 500 Specific Humidity 900 Specific Humidity LLV • Specific humidity perturbations associated with the MLV include moist convection. Those associated with the LLV are dominated by advection. • Gradients matter! The low-level moisture anomalies are where the boundary between the Saharan air layer and monsoon layer is located. Rel. Latitude Rel. Latitude Rel. Longitude Rel. Longitude Specific Humidity (+6 Lat.) Specific Humidity (0 Lat.) MLV Axis MLV Axis Pressure Pressure E E W W Rel. Longitude Rel. Longitude Specific Hum (g kg-1) Introduction| Methods | Convection| Reanalysis | Radiosonde | Summary
Parcel Buoyancy Plan Views • Buoyancy is defined as… • Tvparcel – Tvenvironment • for a parcel in psuedo-adiabatic ascent. • The southerly moisture flux enhances low-level buoyancy (reduces negative area). • Advection of dry SAL air reduces low-level buoyancy. • Moist southerlies undercutting the SAL enhances upper-level buoyancy (increaces positive area); the warm anomaly above the MLV reduces it. 800 Parcel Buoyancy 500 Parcel Buoyancy Moisture More CAPE Dry air More CIN Rel. Latitude Rel. Latitude PV cool anomaly & moisture Less CIN PV warm anomaly Less CAPE Rel. Longitude Rel. Longitude Buoyancy (K) Introduction| Methods | Convection| Reanalysis | Radiosonde | Summary
AMMA Campaign 2006 Radiosondes • Radiosonde composites were generated for JAS 2006 when the objectively tracked PV anomalies passed within 5° of a station. • Niamey - 15 events • Parakou - 14 events • Is the thermodynamic modification by the AEW more important to the north than to the south? Parcel Buoyancy (K) JJAS 04-08 LFC 0 5N 10N 15N 20N 25N 30N Parakou Niamey Introduction| Methods | Convection| Reanalysis | Radiosonde | Summary
Niamey and Parakou Radiosonde Composites Niamey Parcel Buoyancy (K) 6 5 4 3 2 1 0 -1 -2 -3 -4 Niamey Negative Area • Negative area in the southerlies is also about half that of the northerlies. • Moisture advection and changes in negative area are more important the farther north one goes. Pressure Lag (Days) Lag (Days) Parakou Parcel Buoyancy (K) 6 5 4 3 2 1 0 -1 -2 -3 -4 Parakou Negative Area Pressure Lag (Days) Lag (Days) Introduction| Methods | Convection| Reanalysis | Radiosonde | Summary
Summary • Low-level adiabatic forcing ahead of the MLV agrees well with the location of MCS genesis. • Thermodynamics are important for AEWs that track north or for locations near the MLV. • The LLV moisture advection played a role in 17 of the 30 convective events impacting Niamey during AMMA SOP2 (Poster 9A-1). Dry Air Moist Air Low-level adiabatic forcing. Introduction| Methods | Convection| Reanalysis | Radiosonde | Summary
Future Work Curvature Vorticity and TRMM Rain http://www.atmos.albany.edu/student/janiga/weather_maps.htm • How do these composites vary with: geography, season, and through the lifetime of the AEW? Introduction| Methods | Convection| Reanalysis | Radiosonde | Summary