Download
1 / 29
290 likes | 407 Views
Comparing HIV and AIDS Prevalence within Countries. By: Dan Evans Ida Nordestgaard Lacey McLean. Economic Statistics 120. 30 April 2009. Research Question: What is the social impact of HIV/AIDS? What can we do to lower the AIDS prevalence rate in countries?.

E N D
Comparing HIV and AIDS Prevalence within Countries By: Dan Evans Ida Nordestgaard Lacey McLean Economic Statistics 120 30 April 2009
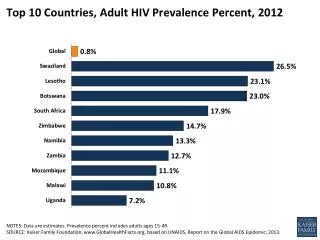
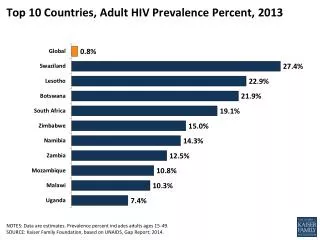
Research Question:What is the social impact of HIV/AIDS?What can we do to lower the AIDS prevalence rate in countries? Over 1/5th of deaths in Africa are due to AIDS
Estimated number of people living with HIV, by region(1990-2006)
Countries We Included In Our Study: • Sub-Saharan African Countries • Angola • Benin • Botswana • Burkina Faso • Burundi • Cameroon • Central African Republic • Chad • Comoros • Congo • Cote D’Ivoire • Democratic Republic of the Congo • Djibouti • Equilateral Guinea • Eritrea • Ethiopia • Gabon • Gambia • Ghana • Guinea • Guinea-Bissau • Kenya • Lesotho • Liberia • Madagascar • Malawui • Mali • Mauritania • Mauritius • Mozambique • Nambia • Niger • Nigeria • Rwanda • Senegal • Sierra Leone • Somalia • South Africa • Swaziland • Tanzania • Togo • Uganda • Zambia • Zimbabwe • Sub-Saharan African countries are home to 70% of total world HIV positive population Wealthiest Countries • USA • China • Japan • India • Germany • UK • Russia • France • Brazil • Italy
Measuring Social Cost of HIV/AIDS:“It is no exaggeration to say that today AIDS is the greatest threat to Africa’s development.”-K.Y. Amoako, Executive SecretaryUN Economic Commission for Africa Factors we considered: • GDP per Capita • Life Expectancy • Literacy Rate • GDP Real Growth Rate • Unemployment Rate
Hypotheses: • The higher the AIDS prevalence rate, the lower the GDP per Capita • The higher the AIDS prevalence rate, the lower the Life Expectancy • The higher the AIDS prevalence rate, the lower the Literacy Rate • The higher the AIDS prevalence rate, the lower the GDP Real Growth Rate • The higher the AIDS prevalence rate, the higher the Unemployment Rate
GDPP Per Capita Our results indicate a negative relationship between HIV/AIDS Prevalence rate and GDPP
Life Expectancy Our results indicate a negative relationship between HIV/AIDS Prevalence rate and Life Expectancy
Literacy Rate Our results indicate a positive relationship between HIV/AIDS prevalence rate and literacy rate
GDP Real Growth Rate Our results indicate a negative relationship between HIV/AIDS Prevalence rate and GDP Real Growth Rate
Unemployment Rate Our results indicate a positive relationship between HIV/AIDS Prevalence rate and the unemployment rate
Results We can conclude statistically that the AIDS prevalence rate affects Life Expectancy. We were surprised to find that these factors were affected by the AIDS rate, and will not dismiss the possibility that GDP per Capita, GDP Growth, Literacy Rate and Unemployment may be affected. If relief funding from organizations increases, lowering the AIDS prevalence rate, it can be inferred from our data that Life Expectancy will rise. Possible Limitations: • Data collected within the Sub-Saharan African region is questionable because of instability within the country due to the AIDS epidemic • We collected the most recent data available, however the AIDS epidemic continues to growth and expand • Selection of countries
Funding Toward AIDS • Global Spending on AIDS has increased from $3 million in 1996 to $6.1 in 2004. • It was projected in 2008 the world would need to spend $22 billion to effectively respond to the epidemic. • Sources of funding include: • National Governments • Multilateral Funding Organizations • Private Sector Funding • Domestic Resources • Projected distribution of resources: • 38% HIV care and treatment • 35% for prevention • 22% for orphan support • 5% for policy, advocacy and administration costs
The Social Costs of AIDS“AIDS is negatively affecting every aspect of the social, economic and political development of Africa. It strikes people down in their prime, when they are raising their children, farming their lands, earning their wages, teaching future generations and leading their countries. By the same token, every development challenge that Africa is facing, whether poverty, poor health, gender inequality, or war and instability, is contributing and driving the spread of AIDS.”- Mr. Kevin Perkins, Executive Director,CanadaAfrica Partnership on AIDS
For Additional Information: • CIA World Fact Book • AIDS.ORG • UNICEF.ORG • JournAIDS.ORG • World Health Organization