Download
1 / 33
340 likes | 465 Views
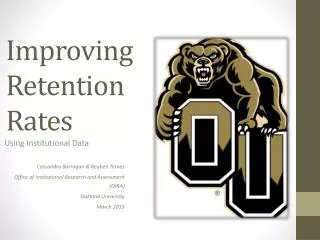
Improving Retention Rates . Cassandra Barragan & Reuben Ternes Office of Institutional Research and Assessment (OIRA) Oakland University March 2013. Using Institutional Data. Presentation Outline. Introduction to OIRA Section I: Sources of data Surveys University

E N D
Improving Retention Rates Cassandra Barragan & Reuben Ternes Office of Institutional Research and Assessment (OIRA) Oakland University March 2013 Using Institutional Data
Presentation Outline • Introduction to OIRA • Section I: Sources of data • Surveys • University • Section II: Policy Analysis • Section III: Predictive Modeling
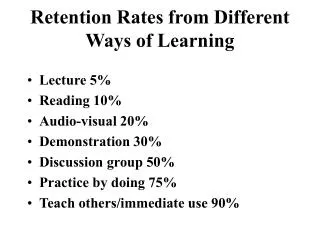
Session Goals • Why are we giving this presentation? • Answer: • Many institutions have a vibrant and robust institutional research office that do all kinds of really neat research about students and student retention. • Our goal is to familiarize you with the types of resources that you may already have at your campus • Partnering with your IR office can be a valuable way to boost your efforts to improve student success and retention!
Introduction to OIRA • About OIRA • The Office of Institutional Research and Assessment (OIRA) supports the planning, decision-making and self-assessment activities of the university community by providing and coordinating information about the progress of OU’s efforts to continuously improve itself. • Most institutions have an IR office • Other Names for IR offices: Budget & Planning, Institutional Effectiveness, Institutional Assessment, etc. • We fill out external surveys, conduct original research, organize internal surveys, report official statistics, and are otherwise responsible for producing a host of different institutional data for the consumption of the university.
What Data is on our Website? • Enrollment Data • Degrees Awarded • Information about the Assessment of Student Learning • National Student Survey Results • Research on OU Students • Comparative Departmental Information • Presentations • Historical trend data • Faculty numbers • And much more….
Surveys Internal Surveys – Committees, etc.
IRB approved protocol through Indiana University – Bloomington Survey instrument: http://nsse.iub.edu/pdf/survey_instruments/2013/2013%20NSSE%20Instrument.pdf Results : NSSE Results: http://nsse.iub.edu/html/reports.cfm • Predictive Validity for retention • Level of Academic Challenge (LAC) – significant for # credit hours earned • Student‐Faculty Interaction (SFI) - # credit hours & persistence • Supportive Campus Environment (SCE) • Deep Approaches to Learning (DAL) • Reliability • Measuring of concepts & constructs – internal consistency • Stability over time & repeat administration • Generalizable
Areas Measured by The area of Academic Challenge includes four areas—Higher-Order Learning, Reflective and Integrative Learning, Quantitative Reasoning, and Learning Strategies. Higher-Order Learning—How much courses emphasize advanced thinking skills such as applying theories to practical problems or synthesizing information into new interpretations • Higher-Order Learning (α2004 = .82, α2005 = .82) • HL1 Analyzed the basic elements of an idea, experience, or theory, such as examining a • particular case or situation in depth and considering its components • HL2 Synthesized and organized ideas, information, or experiences into new, more complex • interpretations and relationships • HL3 Made judgments about the value of information, arguments, or methods, such as • examining how others gathered and interpreted data and assessing the soundness of • their conclusions • HL4 Applied theories or concepts to practical problems or in new situations
Established behaviors in high school; • Academic preparedness; • Admissions decisions; • Expectations of college; • Interactions with peers and faculty; • Student values and goals and • Student demographic characteristics; and • Concerns about financing college. • Psychometrics & Constructs: http://www.heri.ucla.edu/PDFs/constructs/technicalreport.pdf • http://www.heri.ucla.edu/constructfaq.php
University Departments • Student Affairs • Student group involvement • Learning community & housing • Registrar’s Office (Academic Affairs) • Class information • Credit hours • College and Major • Demographics • Grades • Much of it pulled from Banner (OU’s ERP system) • Financial Aid • Scholarships • Financial aid offers
Combining Data • Study habits • Personal beliefs • Plans for the future • Engagement in the educational process • Sense of satisfaction • Sense of campus community • Social environment • Faculty/staff involvement • Known predictors of retention • Examine policies • Longitudinal trends • Putting a face to the numbers…what does your student body look like? Data is at aggregate & student level
Finding the data that fits your needs • Researchers • What populations are on your campus? • Educators • Can learn more about your students to tailor their education experience to be as relevant as possible • Administrators • Tell me about our students. What are they telling us & what can we learn from them? • But it should be granular enough to have meaning to individuals! • Data needs to be actionable. • (The retention rate for biology students means more to the biology department than the retention rates for all students)
Policy Analysis • How do you know you are meeting goals and benchmarks? • How do you know that university policies aimed at improving the student experience are working? • Do they impact retention? • What hurts retention efforts? • Where is the biggest “bang for your buck”?
Examples • 1. Advising Policies • Data from internal university records • ACT scores • Enrollment/retention information • Number of credits • 2. Financial Aid & Retention • Data from internal university records • ACT scores • Enrollment/retention information • Number of credits
Example 1: Advising Policies • Should we recommend that students take smaller class loads if they have lower ACT scores? • Rationale: We don’t want to ‘overload’ students that might not be academically underprepared. • What does the data say? • Retention rates do drop as ACT scores decline. • But the decline is small. • The data also show that the more credits a student takes, the more likely they are to be retained. • The data isn’t causative, its correlational. • However, there just isn’t any data to support the ‘overload’ theory.
Augmenting University Data You can get a good picture about retention through university data, but other sources may help to understand the “why”. • Advising policy findings: Students with more credits and higher ACT scores have higher retention rates but those with higher ACT scores and lower credits have a lower retention rate. • Question: Why is the retention rate low even for those with high ACT scores • Is there something in the demographic profile? • Personality profile? • Reasons to attend?
Example 2: Financial Aid Policy • In order to qualify for our large institutional grants you must have an ACT score of a 21 or higher. • Must demonstrate need • The grant size is usually substantial (several thousand dollars). • What is the impact of our need-based aid on student retention? • Can we get at a causative answer instead of just correlational?
Getting to causality… • We can get at a causative answer by using a regression discontinuity framework. • Basically, we graph things and look at the relationship right near the area where things are similar in criteria, but have vastly different in experience. • For us, we will look at students just below the cut-off score (ACT 21). • These students are similar to those just above them. But have vastly different experiences.
The Dashed Lines • The dashed lines represent students that have not demonstrated financial need. • They are separated into two groups, those with ACT scores 21 and above. • And those with scores below a 21. • Notice that there is NO gap, or discontinuity between the two groups. • The two dashed lines could be represented by the same color and you would never be able to tell where the discontinuity was.
The Solid Lines • The Red line (on the left) represents students with ACT scores of less than a 21. • These students did not qualify for a large portion of OU’s need-based aid. • The Black solid line (on the right) represents students with ACT scores of a 21 or more. • These students potentially qualify for additional need-based aid. • Notice the HUGE gap between the red and black lines. • This gap is causative evidence that need based aid had a positive impact on the retention of students near the cut-off.
Risk Factors & Retention • One of the easiest ways to model retention is to categorize students into ‘risk factors’ • First Generation • Minority Status • Low Incoming Preparation (ACT/HS GPA) • Pell Eligible • Etc. • Then count the number of risk factors for each student. • Use historical data to forecast new years. • Generally, the model is very good at the aggregate level. • But it’s still pretty crude.
Regression • Alternatively, IR researchers can use regression • Improved flexibility • Can include as many or as few variables as you’d like • Can build interactions • Increased sophistication (not all variables are equally important) • In theory, provides a more reliable retention probability for each student. • In practice, sometimes it does, sometimes it doesn’t. • Regression also has some inherent weaknesses such as: • over-fitting of data • categorical variable issues
Machine Learning Algorithms • A host of relatively new predictive tools are just becoming popular. • Including various machine learning algorithms (MLAs) • These algorithms have several advantages over regression • Have procedures to estimate missing data well • Can reduce the amount of over-fitting • Some MLAs are really easy to use • Can handle hundreds of different variables • Categorical (i.e. non-numerical) data is OK • Many do not make any assumptions at all non-parametric • Overall good performance relative to most regression methods
An Example MLA – Random Forest • Q: What is Random Forest? • A: A tool that makes really good predictions • Q: How does it work? • A: It builds lots of (decision) trees • Randomly • (That’s why it’s called Random Forest)
Advantages & Disadvantages • Advantages • Deals with missing data well • Robust to over-fitting • Relatively easy to use • Can handle hundreds of different variables • Categorical (i.e. non-numerical) data is OK • Makes no assumptions (non-parametric) • Overall good performance • Disadvantages • Probability values are the only statistics generated • List of variables in order of importance, but without statistics to draw your own conclusions For more information about random forest methods: http://www.miair.org/web_documents/using_random_forest_101.pptx
A. Introduction to OIRA • B. Section I: Sources of data • Surveys • University • C. Section II: Policy Analysis • D. Section III: Predictive Modeling • For a copy of this presentation: • http://www.oakland.edu/?id=14323&sid=250 Cassandra Barragan Barragan@oakland.edu Reuben Ternes ternes@oakland.edu Office of Institutional Research and Assessment (OIRA) www.oakland.edu/OIRA Oakland University March 2013 Improving Retention Rates Using Institutional Data