Download
1 / 26
260 likes | 358 Views
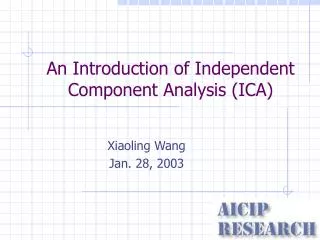
Landing Safety Analysis of An Independent Arrival Runway. Author: Richard Yue Xie John Shortle Presented by: Dr. George Donohue 22/11/2004. ICRAT 2004. Problem Statement. Growth of traffic demand requires more capacity both of airports and airspace.

E N D
Landing Safety Analysis of An Independent Arrival Runway Author: Richard Yue Xie John Shortle Presented by: Dr. George Donohue 22/11/2004 ICRAT 2004
Problem Statement • Growth of traffic demand requires more capacity both of airports and airspace. • Separation reduction is an effective way of increasing capacity. • How will safety be affected? • What’s the current safety level? • What are major factors that will affect safety? • How?
Safety-Capacity Hypothesis More Safe Safety/Capacity IT Extension Safety (Departures / Hull Loss) Less Safe Low High Capacity (Departures / Year) [Donohue et al., 2001] [Shortle et al. 2004]
Safety Issues Considered Simultaneous runway occupancy/landing Runway collision/landing Accidents Incidents Wake-vortex-encounter/approach Loss of control/approach Airplane i+2 Airplane i Airplane i+1 Wake Vortex Encounter Simultaneous Runway Occupancy
Key Safety Metrics Ease of predicting Loss of wake vortex separation Loss of control due to turbulence Wake vortex encounter Simultaneous runway occupancy Runway collision Incidents Accidents Metric relevance This paper focuses on
Data Samples of Landing Time Interval Loss Safety Loss Capacity Courtesy of Haynie, Doctoral dissertation, GMU, 2002
An Observation of ATL Landing Runways Mar.5 and 6, 2001 ATL 26L, 364 valid data (Haynie, 2002) LTI: Landing Time Interval ROT: Runway Occupancy Time SRO: Simultaneous Runway Occupancy ROT LTI Indicate a positive probability of Simultaneous Runway Occupancy.
Analytical Model Vs. Simulation Model • Advantages of analytical models: • Computational efficiency • Consistency • Clarity • Accuracy • Disadvantages of analytical models: • Limited applicability • Over simplification • Dependencies
A Queuing Model for Safety Analysis TRACON – Final Approach Final Approach - Runway aircraft separation aircraft separation RWY Threshold TRACON RWY Exit
Simplification in the Model • Fleet mixture is not explicitly modeled (In VFR, separation differences for different mix are not remarkable); • Arrival process is approximated using a Poisson process, although not justified theoretically; • Service time, which is the desired separation, can be approximated using a Gaussian distribution. • Runway occupancy time follows a Gaussian distribution N(48,82) seconds.
Model Validation • Simulation results of an M/G/1 model shows good consistency with observations. Arrival rate 29 acft/hour, G is Gaussian(80,112) in second.
Analytical Evaluation of Safety • Prob(SRO) = Prob(LTI* < ROT) = • Prob(LTI-ROT <0) • LTI is the inter-departure time of the M/G/1** queuing model. • LTI is a function of M and G. • LTI’s distribution = ? * LTI: Landing Time Interval ** M means the arrival process is a Poisson process; G means the service time follows a non-exponential distribution.
Departure Process of A Queue 1. If server is busy, inter-departure time is the same as service time; 2. If server is idle, inter-departure = inter-arrival + service observer aircraft separation pd= prob(server busy)*pd1+prob(server idle)*pd2 For an M/M/1 queue: r<1 r>1
Service time in M/G/1 A Gaussian distribution can be approximated by a finite sum of xkexp(-ux). P is transition matrix, q is exit vector e is a vector of 1’s Define the completion rate matrix M as a diagonal matrix with elements Mii = mi , where mi is the rate of leaving state i. Service rate matrix B is Service time matrix V is V = B-1
Distribution of Service Time Define the operator Y[X] = pXe' , p is the entrance vector CDF of service time: PDF of service time:
Inter-Departure Time in M/G/1 If r goes to 1, d(t) = s(t). If r goes to 0, (1-lV)is close to 1, the inter-departure time will distribute like the inter-arrival time with the density function le-lx. For more information, please refer to Xie and Shortle, Landing Safety Analysis of An Independent Arrival Runway, ICRAT, 2004; Lipsky, Queuing Theory – A Linear Algebraic Approach, 1992.
Landing Time Interval Distributions Erlang’s Mean Std.dev 70.7 9.7 118 15.4 70 8.4
Prob.(SRO) Parameter values: Inter-arrival: exponential(124 sec) Mean of desired separation: 80 sec, std.dev is 11 sec. Mean of runway occupancy time is 48 sec., std.dev is 8 sec. The calculated probability of SRO is 0.00312.
Factors That Affect Safety Arrival rate Mean and variance of desired separation Mean and variance of runway occupancy time Landing safety Other incidents, e.g. human error, equipment failure,…
How ROT Affects Safety Mean and variance of runway occupancy time Landing safety ROT: Runway Occupancy Time
How Separation Affects Safety Mean and variance of desired separation Prob.(SRO) Landing safety Std.Dev of desired separation (sec.) Mean of desired separation (sec.)
Separation Vs. Safety Separation Deviation (sec.): Prob(SRO) Mean(Desired Separation) (sec.)
Capacity-Safety Separation Deviation (sec.): Landings/SRO Here we are! Landings/hour
Safety-Capacity Hypothesis More Safe Safety/Capacity IT Extension Safety (Departures / Hull Loss) Less Safe Low High Capacity (Departures / Year) [Donohue et al., 2001] [Shortle et al. 2004]
Summary • An M/G/1 queuing model can effectively represent a randomly,unsynchronizedly scheduled airport’s arrival process. • Landing safety is significantly affected by variances of runway occupancy time and separation • Both average value and variance should be considered in policy making.