Download
1 / 21
210 likes | 212 Views
Learn how CHOP leveraged R to automate the investigation of potential pediatric health disparities, addressing the challenges of manual data analysis and generating stratified data sets and graphs. Discover how the internal demographics package identifies potential disparities and aids in quality improvement initiatives.

E N D
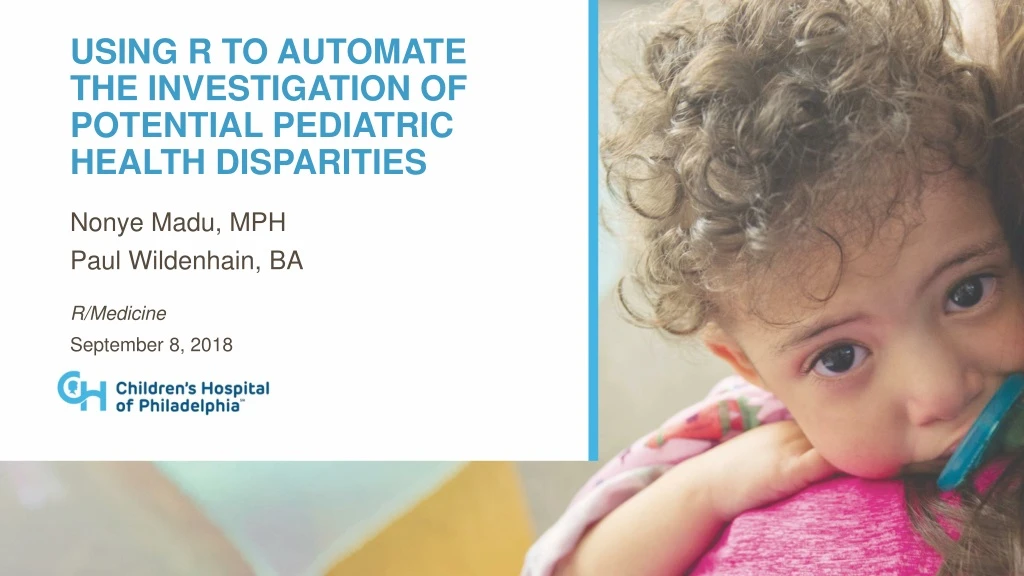
Using R to Automate the Investigation of POTENTIAL Pediatric Health Disparities Nonye Madu, MPH Paul Wildenhain, BA R/Medicine September 8, 2018
CHOP is using R to jumpstart the investigation of potential pediatric health disparities • An assessment of previous project work revealed a dearth of initiatives directly relating to the investigation of potential health disparities • A strong desire to address this gap was not enough to overcome the challenges of performing manual data analysis • We leveraged existing data infrastructure to create an internal R package that automatically generates stratified data sets and graphs
Who we are and who we serve CHOP Facts • The nation’s first pediatric hospital • 546 beds, >1 million inpatient and outpatient visits per year • 250 active international patients per month • Robust quality improvement program
What is the purpose of quality improvement? • Incorporating evidence-based care into practice with the goal of… • Standardizing/reducing variation • Increasing efficiency/reducing waste • Improving outcomes/minimizing harm • CHOP’s Office of Clinical Quality Improvement (OCQI) partners with clinical teams to help pinpoint issues, identify driving factors, test changes, and sustain progress
Reducing X-Ray Use: A successful QI initiative AAP Pathway Revision Desired Metric Direction
But what if we examine the data differently? AAP Pathway Revision Desired Metric Direction
You won’t know if something might be happening unless you look.
We have not been looking and need to start 10 Total QI initiatives worked on by OCQI (completed or in progress) since July 2013: 159 Barriers to implementing a blanket disparities screen: • Manual work to add in demographic data fields and generate stratified visualizations is time consuming • Manual analysis = tougher implementation of a standardized screening protocol 20 24 35 16 6 14 1 7
The need for simple, systematic approach to screening for potential disparities led to the creation of the internal demographics package.
The internal demographics package was the right solution Resources at our disposal: • Enterprise data warehouse containing data from our EMR • Data mart structure where project cohorts and metrics were packaged into predefined tables • Ongoing team initiative to increase R utilization • Experience creating an internal R package to automatically generate statistical process control charts
The demographics package automatically generates stratified charts • Outputs three charts, stratifying the given metric by three different demographic categories: • Race/Ethnicity, Insurance Payer Type, Primary Language • Demographic information added automatically to cohort based on patient medical record number and visit account number • Charts can be either bar or run charts • Bar charts useful for an overall summary—default argument • Run charts useful to establish if differences changed over time
The demographics package automatically generates stratified charts Back-End Process: • GATHER • VISUALIZE • MANIPULATE Prepare data for plotting Iteratively generate plots Retrieve demographic data and add to cohort
The demographics package automatically generates stratified charts
How has the demographicspackage been used to identify potential disparities?
Case study #1: AKI in the ICU Project Overview Cohort: Patients with acute kidney injury (AKI) in an intensive care unit (ICU) on invasive ventilation Goal: Reduce the total days spent on invasive ventilation Bar charts were generated because: there is limited historical data available for this cohort
Case study #2: NPO Clear Fluid Fasting Time Project Overview Cohort: Patients coming from home for an anesthetic procedure who were discharged on the same day Goal: Reduce the NPO clear fluid fasting time to 4 hours or less for 60% of cases Run charts were generated because: there is ample historical data from the point of the first intervention
Case study #2: NPO Clear Fluid Fasting Time Pre-Intervention #1 (Dec 2017) Average: Non-Hispanic White: 24% Non-Hispanic Black: 16% Difference: 8% Intervention Post-Intervention #1 Average: Non-Hispanic White: 53% Non-Hispanic Black: 37% Difference: 16%
Moving Forward Technical Enhancements • Leverage data marts and project metadata repository to automatically run function • Create dashboard for easy exploration • Add more stratification variables Infrastructure Building • Establish a workgroup dedicated to disparities investigation • Use data to generate stories and create guidance The package is not for drawing conclusions, but for having data to serve as a starting point.
SummaryDisparities potentially exist, but investigation must precede action.R is a great tool for automating analyses addressing organizational gaps. Presenter Contact Information: Nonye Madu, Senior Clinical Data Analyst – maduc@email.chop.edu Paul Wildenhain, Clinical Data Analyst II – wildenhaip@email.chop.edu GitHub mirror: https://github.com/chop-analytics/demographics CHOP’s QI Program: https://www.chop.edu/centers-programs/quality-and-patient-safety Also, we’re hiring! Contact us for more information if interested!