Download
1 / 5
50 likes | 137 Views
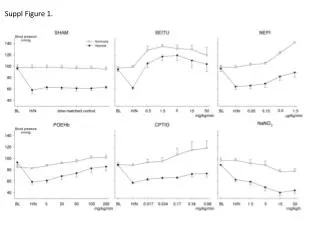
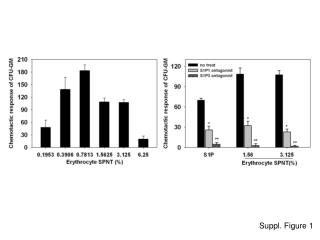
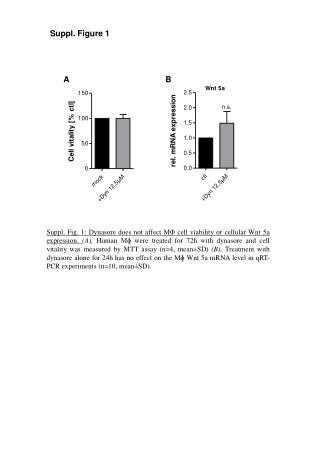
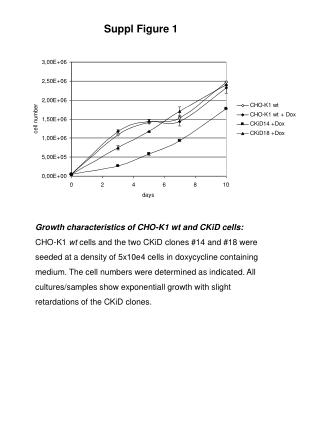
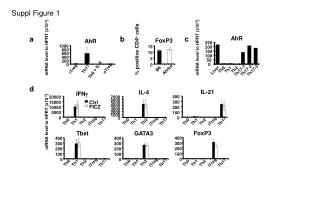
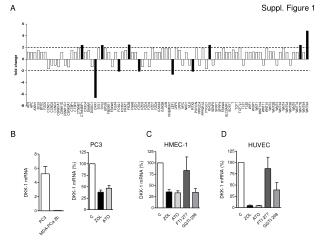
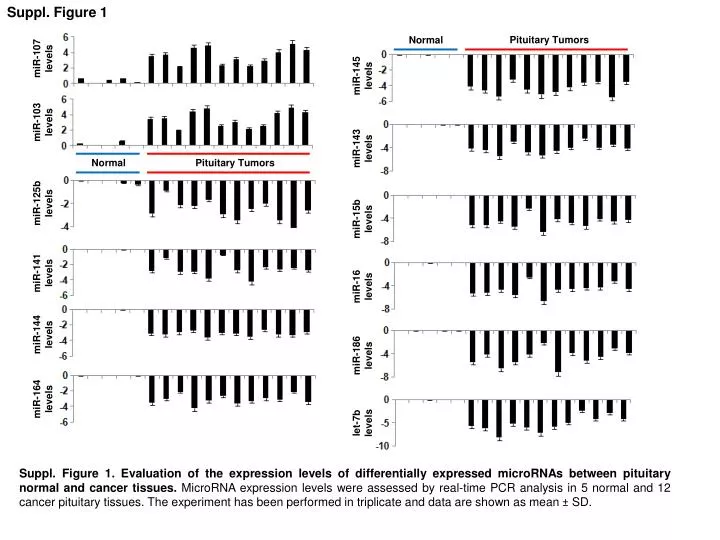
Suppl. Figure 1. Pituitary Tumors. Normal. miR-107 levels. miR-145 levels. miR-103 levels. miR-143 levels. Normal. Pituitary Tumors. miR-125b levels. miR-15b levels. miR-141 levels. miR-16 levels. miR-144 levels. miR-186 levels. miR-164 levels. let-7b levels.

E N D
Suppl. Figure 1 Pituitary Tumors Normal miR-107 levels miR-145 levels miR-103 levels miR-143 levels Normal Pituitary Tumors miR-125b levels miR-15b levels miR-141 levels miR-16 levels miR-144 levels miR-186 levels miR-164 levels let-7b levels Suppl. Figure 1. Evaluation of the expression levels of differentially expressed microRNAs between pituitary normal and cancer tissues. MicroRNA expression levels were assessed by real-time PCR analysis in 5 normal and 12 cancer pituitary tissues. The experiment has been performed in triplicate and data are shown as mean ± SD.
Suppl. Figure 2 8-mer 8-mer 3’UTR BMI1 UGUGCAGCCACGUCACUGUGA 3’UTR PTEN UGUUAGGGAAUUUUACUUGAA miR-128 UUUCUCUGGCCAAGUGACACU miR-26b UGGAUAGGACUUAAUGAACUU BMI1 1 459-65 1654 PTEN 1 1278-84 3295 3’ UTR 3’ UTR Suppl. Figure 2. Sequence complementarity between miR-26b and the 3’UTR of PTEN gene and between miR-128 and the 3’UTR of BMI1 gene.
Suppl. Figure 3 a # of colonies # of colonies - + - - - - + - - - as-miR NC as-miR NC - - + + + - - + + + as-miR-26b as-miR-128 - - - + - - - - + - siRNA NC siRNA NC - - - - + - - - - + siRNA-PTEN siRNA-BMI1 b # of invading cells # of invading cells - + - - - - + - - - as-miR NC as-miR NC - - + + + - - + + + as-miR-26b as-miR-128 - - - + - - - - + - siRNA NC siRNA NC - - - - + - - - - + siRNA-PTEN siRNA-BMI1 Suppl. Figure 3. MiR-26b and miR-128 control the tumorigenicity and invasiveness of AtT-20 pituitary tumors cell through regulation of PTEN and BMI1, respectively. (a) Number of colonies (mean ± SD) and (b)invading AtT-20 cells untreated or treated with 50nM antisense-microRNA negative control (as-miR-NC), antisense-microRNA-26b (as-miR-26b), antisense-microRNA-128 (as-miR-128), siRNA negative control (siRNA NC) and siRNA against PTEN (siRNA-PTEN).
Suppl. Figure 4 b c a p<0.0001 # of invading cells - + - - - - miR-NC - - + - - - as-miR-NC - - - + - + as-miR-26b - - - - + + miR-128 d e f PTEN mRNA levels AKT phosph levels # of invading cells # of colonies p<0.0001 - + - - - - # of colonies - + - - - - miR-NC miR-NC - - + - - - - - + - - - as-miR-NC as-miR-NC - + + + as-miR-26b - - - + - + Suppl. Figure 4. MiR-26 and miR-128 regulate the PTEN-AKT pathway in AtT-20 pituitary cells. (a)Number of colonies and (b) invading AtT-20 cells, untreated or treated with 50nM miR-NC, as-miR-NC, as-miR-26b and miR-128. (c) Fold enrichment of BMI1 in the promoter area of PTEN in AtT-20 cells treated with 50NM as-miR-NC or as-miR-128, assessed by chromatin immunoprecipitation followed by real-time PCR analysis. (d) PTEN mRNA expression levels (mean ± SD) assessed by real-time PCR analysis and (e)AKT phosphorylation levels (S473) in AtT-20 cells treated for 48h with 50nM as-miR-NC, as-miR-128, miR-26b and their combinations. (f) Number of colonies and invading AtT-20 cells, untreated or treated with 50nM as-miR-26b and miR-128 or combination of as-miR-26b, miR-128 and siRNA NC or combination of as-miR-26b, miR-128 and siRNA-PTEN. The experiments have been performed in triplicate and data are shown as mean ± SD. - - - + - + as-miR-128 as-miR-128 - + + + - + + + as-miR-26b miR-128 - - - - + + - - - - + + miR-26b miR-26b - + + + - - + + miR-128 siRNA NC - + - - - - - - + + - - - + miR-NC siRNA NC siRNA-PTEN - - + - - - - - - + as-miR-NC siRNA-PTEN - - - + - + as-miR-26b - - - - + + miR-128
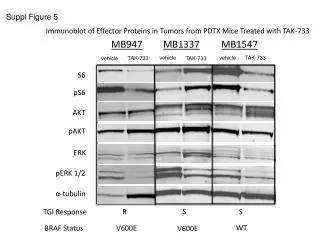
Suppl. Figure 5 # of invading cells GH3 MtT/S - + + + as-miR-26b - + + + miR-128 - - + + siRNA NC - - - + siRNA-PTEN Suppl. Figure 5. Number of invading GH3 and MtT/S cells, untreated or treated with 50nM as-miR-26b and miR-128 or combination of as-miR-26b, miR-128 and siRNA NC or combination of as-miR-26b, miR-128 and siRNA-PTEN. The experiments have been performed in triplicate and data are shown as mean ± SD.