1 / 1

Suppl. Figure 4

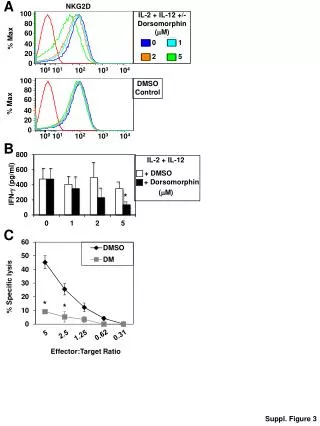
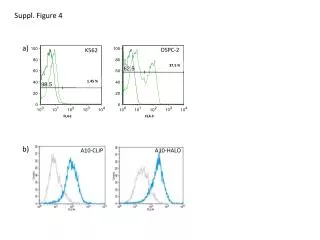
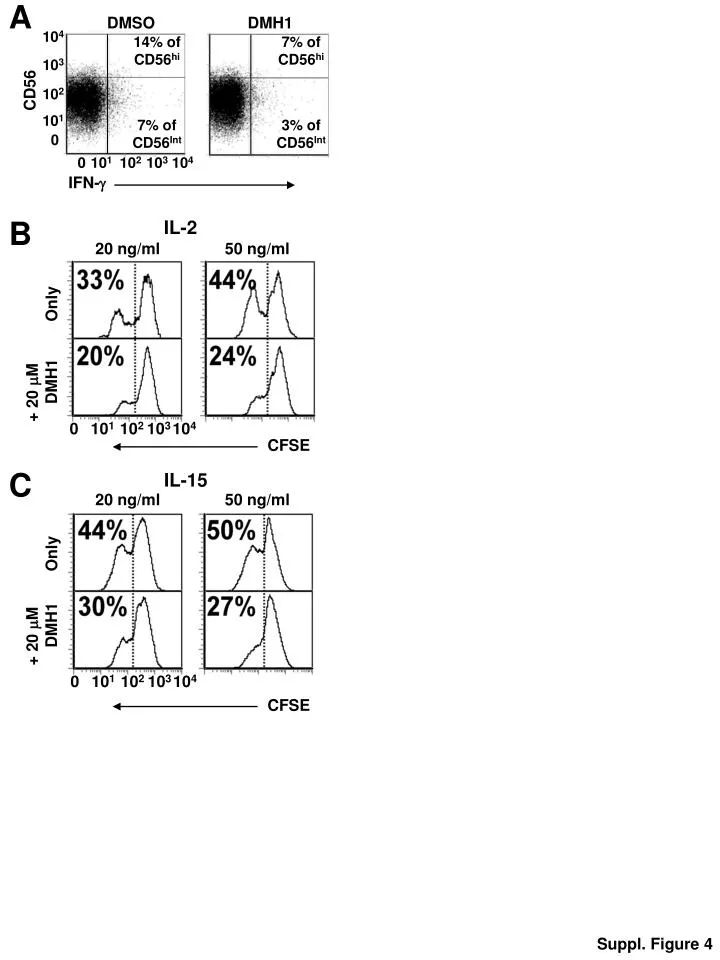
A. DMSO. DMH1. 10 4. 14% of CD56 hi. 7% of CD56 hi. 10 3. CD56. 10 2. 7 % of CD56 Int. 3% of CD56 Int. 10 1. 0. 0. 10 1. 10 2. 10 3. 10 4. IFN- . B. IL-2. 20 ng /ml. 5 0 ng /ml. Only. + 20  M DMH1. 0. 10 1. 10 2. 10 3. 10 4. CFSE. C. IL-15.

tate
Download Presentation

Suppl. Figure 4

An Image/Link below is provided (as is) to download presentation Download Policy: Content on the Website is provided to you AS IS for your information and personal use and may not be sold / licensed / shared on other websites without getting consent from its author. Content is provided to you AS IS for your information and personal use only. Download presentation by click this link. While downloading, if for some reason you are not able to download a presentation, the publisher may have deleted the file from their server. During download, if you can't get a presentation, the file might be deleted by the publisher.

E N D

Presentation Transcript


  1. A DMSO DMH1 104 14% of CD56hi 7% of CD56hi 103 CD56 102 7% of CD56Int 3% of CD56Int 101 0 0 101 102 103 104 IFN- B IL-2 20 ng/ml 50 ng/ml Only + 20 M DMH1 0 101 102 103 104 CFSE C IL-15 20 ng/ml 50 ng/ml Only + 20 M DMH1 0 101 102 103 104 CFSE Suppl. Figure 4

More Related