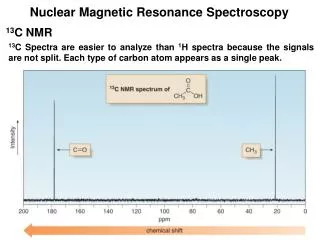
Download
1 / 43
430 likes | 645 Views
Chapter 13 Nuclear Magnetic Resonance Spectroscopy. Assignment for Chapter 13. 13.1 through 13.14 13.16 and 13.18 SKIP 13.15 and 13.17. Problem Assignment. In text problems 2 - 16 22 a, b, d, g 24, 25 End of chapter problems 27, 28, 29, 30, 31, 35, 39a, b

E N D
Chapter 13 Nuclear Magnetic Resonance Spectroscopy
Assignment for Chapter 13 • 13.1 through 13.14 13.16 and 13.18 • SKIP 13.15 and 13.17
Problem Assignment • In text problems 2 - 16 22 a, b, d, g 24, 25 • End of chapter problems 27, 28, 29, 30, 31, 35, 39a, b 40 a, c, d, f 41 a, b, c, d
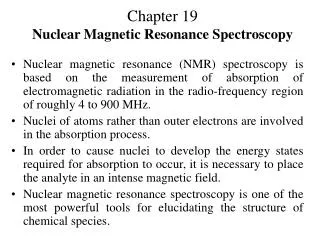
13.1 Spin Quantum Numbers of Some Nuclei The most abundant isotopes of C and O do not have spin. Element1H 2H 12C 13C 14N 16O 17O 19F Nuclear Spin Quantum No1/2 1 0 1/2 1 0 5/21/2 ( I ) No. of Spin 2 3 0 2 3 0 6 2 States Elements with either odd mass or odd atomic number have the property of nuclear “spin”. The number of spin states is 2I + 1, whereI is the spin quantum number.
13.2 Nuclear Resonance absorption of energy by the spinning nucleus
Nuclear Spin Energy Levels N -1/2 unaligned In a strong magnetic field (Bo) the two spin states differ in energy. +1/2 aligned Bo S
The Energy Separation Depends on Bo - 1/2 = kBo = hn DE degenerate at Bo = 0 + 1/2 Bo increasing magnetic field strength
The Larmor Equation!!! DE = kBo = hncan be transformed into gyromagnetic ratio g g n = 2p gB0 n = 2p frequency of the incoming radiation that will cause a transition Bo strength of the magnetic field g is a constant which is different for each atomic nucleus (H, C, N, etc)
Resonance Frequencies of Selected Nuclei Isotope Abundance Bo (Tesla) Frequency(MHz) g(radians/Tesla) 1H 99.98% 1.00 42.6 267.53 1.41 60.0 2.35 100.0 7.05 300.0 13C 1.108% 1.00 10.7 67.28 2.35 25.0 7.05 75.0
13.3 Classical Instrumentation: The Continuous-Wave NMR typical before 1965; field is scanned
A Simplified 60 MHzNMR Spectrometer hn RF (60 MHz) Oscillator RF Detector absorption signal Recorder Transmitter Receiver MAGNET MAGNET ~ 1.41 Tesla (+/-) a few ppm N S Probe
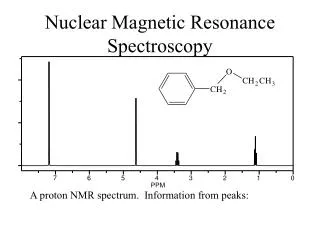
NMR Spectrum of Phenylacetone EACH DIFFERENT TYPE OF PROTON COMES AT A DIFFERENT PLACE - YOU CAN TELL HOW MANY DIFFERENT TYPES OF PROTONS THERE ARE BY INTEGRATION.
13.4 Modern Instrumentation: the Fourier-Transform NMR FT-NMR requires a computer
PULSED EXCITATION N n2 n1 BROADBAND RF PULSE contains a range of frequencies n3 (n1 ..... nn) S All types of hydrogen are excited simultaneously with the single RF pulse.
NMR Spectrum of Phenylacetone EACH DIFFERENT TYPE OF PROTON COMES AT A DIFFERENT PLACE - YOU CAN TELL HOW MANY DIFFERENT TYPES OF PROTONS THERE ARE BY INTEGRATION.
Some Generalizations • NMR solvents contain deuterium • Tetramethylsilane (TMS) is the reference • Spectrum of 1,2,2-trichloropropane • Chemical shift in Hz from TMS vary according to frequency of spectrometer! • Delta values (d) are independent of frequency of spectrometer (ppm)
PEAKS ARE MEASURED RELATIVE TO TMS Rather than measure the exact resonance position of a peak, we measure how far downfield it is shifted from TMS. reference compound tetramethylsilane “TMS” Highly shielded protons appear way upfield. TMS Chemists originally thought no other compound would come at a higher field than TMS. shift in Hz downfield n 0
HIGHER FREQUENCIES GIVE LARGER SHIFTS The shift observed for a given proton in Hz also depends on the frequency of the instrument used. Higher frequencies = larger shifts in Hz. TMS shift in Hz downfield n 0
THE CHEMICAL SHIFT The shifts from TMS in Hz are bigger in higher field instruments (300 MHz, 500 MHz) than they are in the lower field instruments (100 MHz, 60 MHz). We can adjust the shift to a field-independent value, the “chemical shift” in the following way: parts per million shift in Hz chemical shift = d = = ppm spectrometer frequency in MHz This division gives a number independent of the instrument used. A particular proton in a given molecule will always come at the same chemical shift (constant value).
13.6 and 13.7 The Chemical Shift
Generalizations • electrons shield nucleus • electronegativity: withdraws electrons to deshield nucleus • downfield (deshielding) = left side of spectrum • upfield (shielding) = right side of spectrum • delta values increase from right to left!
SPECTRUM DOWNFIELD UPFIELD Less shielded protons appear here. Highly shielded protons appear here. It takes a higher field to cause resonance. PROTONS DIFFER IN THEIR SHIELDING All different types of protons in a molecule have a different amounts of shielding. They all respond differently to the applied magnetic field and appear at different places in the spectrum. This is why an NMR spectrum contains useful information (different types of protons appear in predictable places).
Overview of where protons appear in an NMR spectrum C-H where C is attached to an electronega-tive atom CH on C next to pi bonds aliphatic C-H acid COOH aldehyde CHO benzene CH alkene =C-H X=C-C-H X-C-H 12 10 9 7 6 4 3 2 0
NMR Correlation Chart -OH -NH DOWNFIELD UPFIELD DESHIELDED SHIELDED CHCl3 , TMS d (ppm) 12 11 10 9 8 7 6 5 4 3 2 1 0 H CH2Ar CH2NR2 CH2S C C-H C=C-CH2 CH2-C- CH2F CH2Cl CH2Br CH2I CH2O CH2NO2 C-CH-C RCOOH RCHO C=C C C-CH2-C C-CH3 O
DESHIELDING AND ANISOTROPY Three major factors account for the resonance positions (on the ppm scale) of most protons. 1. Deshielding by electronegative elements. 2. Anisotropic fields usually due to pi-bonded electrons in the molecule. 3. Deshielding due to hydrogen bonding.
DESHIELDING BY ELECTRONEGATIVE ELEMENTS
DESHIELDING BY AN ELECTRONEGATIVE ELEMENT d- d+ Chlorine “deshields” the proton, that is, it takes valence electron density away from carbon, which in turn takes more density from hydrogen deshielding the proton. Cl C H d- d+ electronegative element NMR CHART “deshielded“ protons appear at low field highly shielded protons appear at high field deshielding moves proton resonance to lower field
Electronegativity Dependence of Chemical Shift Dependence of the Chemical Shift of CH3X on the Element X Compound CH3X CH3F CH3OH CH3Cl CH3Br CH3I CH4 (CH3)4Si Element X F O Cl Br I H Si Electronegativity of X 4.0 3.5 3.1 2.8 2.5 2.1 1.8 Chemical shift d 4.26 3.40 3.05 2.68 2.16 0.23 0 most deshielded TMS deshielding increases with the electronegativity of atom X
Substitution Effects on Chemical Shift most deshielded The effect increases with greater numbers of electronegative atoms. CHCl3 CH2Cl2 CH3Cl 7.27 5.30 3.05 ppm most deshielded -CH2-Br -CH2-CH2Br -CH2-CH2CH2Br 3.30 1.69 1.25 ppm The effect decreases with incresing distance.
ANISOTROPIC FIELDS DUE TO THE PRESENCE OF PI BONDS The presence of a nearby p bond greatly affects the chemical shift. Benzene rings have the greatest effect.
ANISOTROPIC FIELD IN AN ALKENE protons are deshielded H H Deshielded shifted downfield fields add C=C H H secondary magnetic (anisotropic) field lines Bo
ANISOTROPIC FIELD FOR AN ALKYNE H C C H secondary magnetic (anisotropic) field Shielded hydrogens are shielded Bo fields subtract
HYDROGEN BONDING DESHIELDS PROTONS The chemical shift depends on how much hydrogen bonding is taking place. Alcohols vary in chemical shift from 0.5 ppm (free OH) to about 5.0 ppm (lots of H bonding). Hydrogen bonding lengthens the O-H bond and reduces the valence electron density around the proton - it is deshielded and shifted downfield in the NMR spectrum.
SOME MORE EXTREME EXAMPLES Carboxylic acids have strong hydrogen bonding - they form dimers. With carboxylic acids the O-H absorptions are found between 10 and 12 ppm very far downfield. In methyl salicylate, which has strong internal hydrogen bonding, the NMR absortion for O-H is at about 14 ppm, way, way downfield. Notice that a 6-membered ring is formed.
INTEGRATION OF A PEAK Not only does each different type of hydrogen give a distinct peak in the NMR spectrum, but we can also tell the relative numbers of each type of hydrogen by a process called integration. Integration = determination of the area under a peak The area under a peak is proportional to the number of protons that generate the peak.
Benzyl Acetate The integral line rises an amount proportional to the number of H in each peak METHOD 1 integral line integral line simplest ratio of the heights 55 : 22 : 33 = 5 : 2 : 3
Benzyl Acetate (FT-NMR) Actually : 5 2 3 21.215 / 11.3 = 1.90 33.929 / 11.3 = 3.00 58.117 / 11.3 = 5.14 METHOD 2 assume CH3 33.929 / 3 = 11.3 per H digital integration Integrals are good to about 10% accuracy. Modern instruments report the integral as a number.