Download
1 / 119
1.22k likes | 1.37k Views
Nuclear Magnetic Resonance Spectroscopy. Dr. Pravin S. Bhale Department of Chemistry Yeshwantrao Chavan Mahahvidyalaya , Tuljapur. SPECTROSCOPY. WHAT IS SPECTROSCOPY? Atoms and molecules interact with electromagnetic radiation (EMR) in a wide variety of ways.

E N D
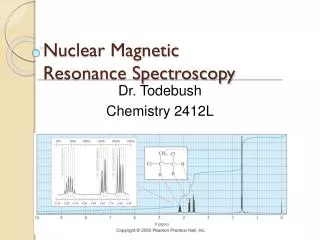
Nuclear Magnetic Resonance Spectroscopy Dr. Pravin S. Bhale Department of Chemistry YeshwantraoChavanMahahvidyalaya, Tuljapur
SPECTROSCOPY WHAT IS SPECTROSCOPY? • Atoms and molecules interact with electromagnetic radiation (EMR) in a wide variety of ways. • Atoms and molecules may absorb and/or emit EMR. • Absorption of EMR stimulates different types of motion in atoms and/or molecules. • The patterns of absorption (wavelengths absorbed and to what extent) and/or emission (wavelengths emitted and their respective intensities) are called ‘spectra’. • The field of spectroscopy is concerned with the interpretation of spectra in terms of atomic and molecular structure (and environment).
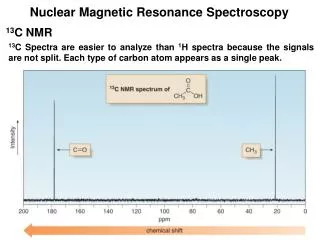
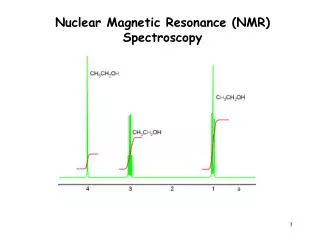
Types of Spectroscopy • Proton Nuclear Magnetic Resonance -deals with hydrogens and their environment • Carbon Nuclear Magnetic Resonance -deals with carbons and their environment • Infrared Absorption -identifies functional groups • Ultra-violet – Visible Absorption -deals with conjugation (alternating single and double-bonds) • Mass Spectrometry -deals with the mass of a molecule and the mass of fragments
1H Nuclear Magnetic Resonance • All organic molecules have protons, the 1H NMR is probably the most • powerful tool to determine the structure of the comp. • The spinning nucleus of the hydrogen atom is just a proton and it acts like a tiny bar magnet. • Therefore, when another magnetic field is applied to this system, they can affect each other. • This gives rise to nuclear resonance spectroscopy (NMR). • This means that they also act differently around each other.
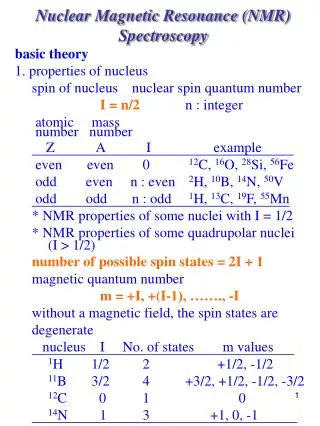
NUCLEAR SPIN The nuclei of some atoms have a property called “SPIN”. These nuclei behave as if they were spinning. ….. we don’t know if they actually do spin! This is like the spin property of an electron, which can have two spins: +1/2 and -1/2 . Each spin-active nucleus has a number of spins defined by its spin quantum number, I.
THE PROTON Although interest is increasing in other nuclei, particulary C-13, the hydrogen nucleus (proton) is studied most frequently, and we will devote our attention to it first.
NUCLEAR SPIN STATES - HYDROGEN NUCLEUS The spin of the positively charged nucleus generates a magnetic moment vector, m. m + + The two states are equivalent in energy in the absence of a magnetic or an electric field. m + 1/2 - 1/2 TWO SPIN STATES
Effect of applied Magnetic Field Absence of Ho Presence of Ho
Precessional Motion Prececessional motion Gyroscope
THE “RESONANCE” PHENOMENON Absorption of energy by the spinning nucleus
Nuclear Spin Energy Levels N -1/2 unaligned In a strong magnetic field (Bo) the two spin states differ in energy. +1/2 aligned Bo S
N w Nuclei precess at frequency w when placed in a strong magnetic field. RADIOFREQUENCY 40 - 600 MHz hn NUCLEAR MAGNETIC RESONANCE If n = w then energy will be absorbed and the spin will invert. NMR S
Absorption of Energy quantized Opposed -1/2 -1/2 DE DE = hn Radiofrequency +1/2 +1/2 Applied Field Bo Aligned
THE ENERGY SEPARATION DEPENDS ON Bo - 1/2 = kBo = hn DE degenerate at Bo = 0 + 1/2 Bo increasing magnetic field strength
POPULATION AND SIGNAL STRENGTH The strength of the NMR signal depends on the Population Difference of the two spin states Radiation induces both upward and downward transitions. induced emission resonance For a net positive signal there must be an excess of spins in the lower state. excess population Saturation = equal populations = no signal
CLASSICAL INSTRUMENTATION typical before 1960 field is scanned
A Simplified 60 MHzNMR Spectrometer hn RF (60 MHz) Oscillator RF Detector absorption signal Recorder Transmitter Receiver MAGNET MAGNET ~ 1.41 Tesla (+/-) a few ppm N S Probe
hn Fortunately, different types of protons precess at different rates in the same magnetic field. N Bo = 1.41 Tesla EXAMPLE: 59.999995 MHz 59.999700 MHz To cause absorption of the incoming 60 MHz the magnetic field strength, Bo , must be increased to a different value for each type of proton. 59.999820 MHz 60 MHz S Differences are very small, in the parts per million range.
IN THE CLASSICAL NMR EXPERIMENT THE INSTRUMENT SCANS FROM “LOW FIELD” TO “HIGH FIELD” LOW FIELD HIGH FIELD NMR CHART increasing Bo DOWNFIELD UPFIELD scan
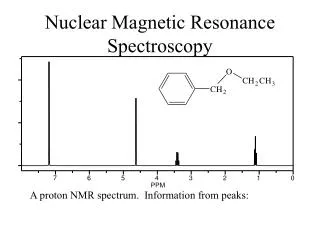
NMR Spectrum of Phenylacetone RECALL Each different type of proton comes at a different place . You can tell how many different types of hydrogen there are in the molecule. from last time
INTEGRATION OF A PEAK Not only does each different type of hydrogen give a distinct peak in the NMR spectrum, but we can also tell the relative numbers of each type of hydrogen by a process called integration. Integration = determination of the area under a peak The area under a peak is proportional to the number of hydrogens that generate the peak.
Benzyl Acetate The integral line rises an amount proportional to the number of H in each peak METHOD 1 integral line integral line simplest ratio of the heights 55 : 22 : 33 = 5 : 2 : 3
MF- C9H10O2 No.of Integrations/proton __Total integrations__ = Total no.of hydrogen 55.5 + 32.5 + 22 ________________ = 10 _____ 110 = 10 = 11 Integrations / Proton i.e.,55.5 = 5H 32.5 = 3H 22.0 = 2H
SPIN-SPIN SPLITTING Often a group of hydrogens will appear as a multiplet rather than as a single peak. Multiplets are named as follows: Singlet Quintet Doublet Septet Triplet Octet Quartet Nonet This happens because of interaction with neighboring hydrogens and is called SPIN-SPIN SPLITTING.
1,1,2-Trichloroethane The two kinds of hydrogens do not appear as single peaks, rather there is a “triplet” and a “doublet”. integral = 2 integral = 1 The subpeaks are due to spin-spin splitting and are predicted by the n+1 rule. triplet doublet
1,1,2-Trichloroethane integral = 2 integral = 1 Where do these multiplets come from ? ….. interaction with neighbors
this hydrogen’s peak is split by its two neighbors these hydrogens are split by their single neighbor MULTIPLETS singlet doublet triplet quartet quintet sextet septet two neighbors n+1 = 3 triplet one neighbor n+1 = 2 doublet
EXCEPTIONS TO THE N+1 RULE IMPORTANT ! Protons that are equivalent by symmetry usually do not split one another 1) no splitting if x=y no splitting if x=y Protons in the same group usually do not split one another 2) more detail later or
EXCEPTIONS TO THE N+1 RULE The n+1 rule applies principally to protons in aliphatic (saturated) chains or on saturated rings. 3) or YES YES but does not apply (in the simple way shown here) to protons on double bonds or on benzene rings. NO NO
SOME COMMON SPLITTING PATTERNS ( x = y ) ( x = y )
SOME EXAMPLE SPECTRA WITH SPLITTING
in higher multiplets the outer peaks are often nearly lost in the baseline 1:6:15:20:16:6:1 NMR Spectrum of 2-Nitropropane
NMR Spectrum of Acetaldehyde offset = 2.0 ppm
INTENSITIES OF MULTIPLET PEAKS PASCAL’S TRIANGLE
The interior entries are the sums of the two numbers immediately above. PASCAL’S TRIANGLE Intensities of multiplet peaks 1 singlet 1 1 doublet 1 2 1 triplet 1 3 3 1 quartet 1 4 6 4 1 quintet 1 5 10 10 5 1 sextet 1 6 15 20 15 6 1 septet 1 7 21 35 35 21 7 1 octet
THE ORIGIN OF SPIN-SPIN SPLITTING HOW IT HAPPENS
THE CHEMICAL SHIFT OF PROTON HA IS AFFECTED BY THE SPIN OF ITS NEIGHBORS aligned with Bo opposed to Bo +1/2 -1/2 50 % of molecules 50 % of molecules H H H H A A C C C C Bo downfield upfield neighbor aligned neighbor opposed At any given time about half of the molecules in solution will have spin +1/2 and the other half will have spin -1/2.
SPIN ARRANGEMENTS one neighbor n+1 = 2 doublet one neighbor n+1 = 2 doublet H H H H C C C C yellow spins blue spins The resonance positions (splitting) of a given hydrogen is affected by the possible spins of its neighbor.
SPIN ARRANGEMENTS two neighbors n+1 = 3 triplet one neighbor n+1 = 2 doublet methine spins methylene spins
H H H H H H C C C C H H H H SPIN ARRANGEMENTS three neighbors n+1 = 4 quartet two neighbors n+1 = 3 triplet methylene spins methyl spins
CHEMICAL SHIFT • The chemical shift is a measure of how far the signal is from the reference signal
PEAKS ARE MEASURED RELATIVE TO TMS Rather than measure the exact resonance position of a peak, we measure how far downfield it is shifted from TMS. reference compound tetramethylsilane “TMS” Highly shielded protons appear way upfield. TMS Chemists originally thought no other compound would come at a higher field than TMS. shift in Hz downfield n 0
HIGHER FREQUENCIES GIVE LARGER SHIFTS The shift observed for a given proton in Hz also depends on the frequency of the instrument used. Higher frequencies = larger shifts in Hz. TMS shift in Hz downfield n 0
THE CHEMICAL SHIFT The shifts from TMS in Hz are bigger in higher field instruments (300 MHz, 500 MHz) than they are in the lower field instruments (100 MHz, 60 MHz). We can adjust the shift to a field-independent value, the “chemical shift” in the following way: parts per million shift in Hz from TMS chemical shift = d = = ppm spectrometer frequency in MHz This division gives a number independent of the instrument used. A particular proton in a given molecule will always come at the same chemical shift (constant value).