Download
1 / 3
30 likes | 237 Views
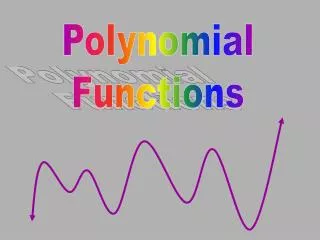
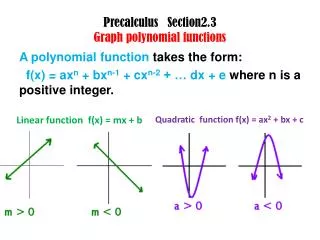
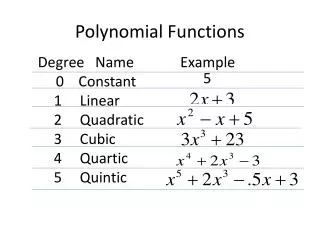
Graph Polynomial Functions y = ax n + …. Beginning and End behavior of functions. A) End behavior: which direction is the graph going (up or down) at the end (the right side). 1) If the leading coefficient is … a) Positive = ends going up b) Negative = ends going down

E N D
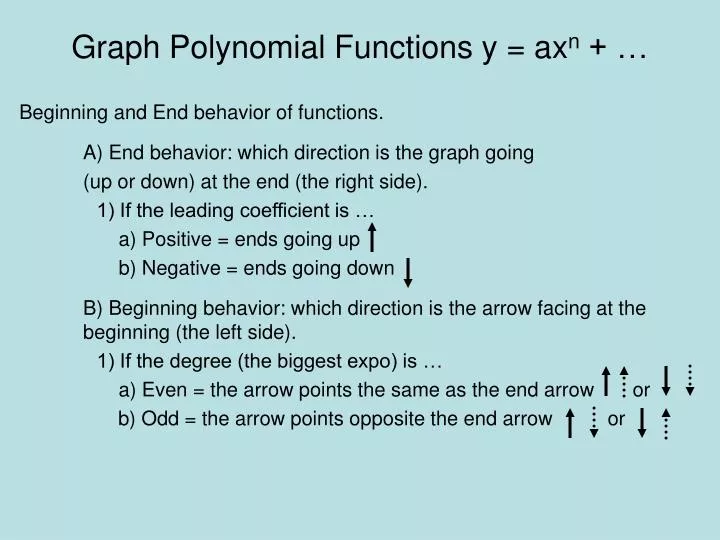
Graph Polynomial Functions y = axn + … Beginning and End behavior of functions. A) End behavior: which direction is the graph going (up or down) at the end (the right side). 1) If the leading coefficient is … a) Positive = ends going up b) Negative = ends going down B) Beginning behavior: which direction is the arrow facing at the beginning (the left side). 1) If the degree (the biggest expo) is … a) Even = the arrow points the same as the end arrow or b) Odd = the arrow points opposite the end arrow or
x-intercepts and what the graph does there. A) The graph will touch each x-intercept. 1) If will either pass through the x-int. or 2) It will bounce at the x-intercept. B) If the factor is (x + n) or (x + n)odd, then it will pass through the x-intercept. C) If the factor is (x + n)even, then it will bounce at the x-intercept.
Sketching the graph using beginning/end behavior and x-intercepts (pass thru or bounce). A) Put dots on all the x-intercepts. The graph will touch each x-intercept. B) From the last x-intercept, sketch the end behavior direction (up + or down – ). C) From the 1st x-intercept, sketch the beginning behavior (even = same, odd = opposite). D) Identify any x-intercepts where your graph will bounce. Then draw a smooth curve from the beginning of your graph to the end, passing thru x-intercepts, or bouncing at them until you reach the last x-intercept (the end behavior).