Download
1 / 62
630 likes | 825 Views
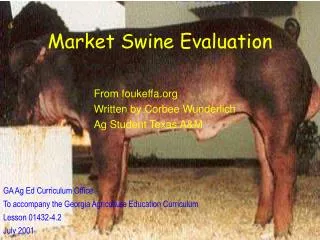
Market Hog Evaluation. History. 1910’s. History. 1920’s Bacon or Lard Type. Champion Hampshire Boar 1925 Chicago Intl. 1920’s. History. Bacon Type: Lighter & Leaner 1924 Champion Chester White Barrow 1924 Champion Pen Three Yorkshrires. 1940’s. History. 1944. 1947. 1950’s.

E N D
History 1910’s
History 1920’s Bacon or Lard Type Champion Hampshire Boar 1925 Chicago Intl
1920’s History Bacon Type: Lighter & Leaner 1924 Champion Chester White Barrow 1924 Champion Pen Three Yorkshrires
1940’s History 1944 1947
1950’s History 1949 1954 1958
1960’s History 1967
1970’s History 1970 1977 1978
1970’s History
1980’s History 1982 1983 1988
1990’s History 1991 1994
Late 1990’s History 1998
2000’s History
2000’s History
2000’s History .4 BF 8.9 LEA, 62.61% Lean
2000’s History
2000’s History
2003 History
1990’s History 1991 2001
1961 1980 1996
1960’s History 35 years of change
Future Complete With Muscle Trend to Heavier constructed Bigger boned & Heavier muscled hogs
Average Market Hog 2000 NPPC lean growth modeling Project: 1550 head of hogs Weight 280 lbs Back fat 1.1” LEA 5.5 Muscle 2 USDA Grade #2
Ideal Market Hog Weight 275 lbs Back fat .8” LEA 6.0 + Muscle 2+ USDA Grade #1
Ideal Market Hog Packers response: - 270 lbs - White Hogs prefered - Hogs that can walk - Minimum fat depth of .6” - Swift/Hormel .8” export market higher - Loin eye 7” - Minimum 54% lean - Stress Free
Ideal Market Hog Quality (Packer response 1) Water holding capacity 2) Color 3) Tenderness 4) IMF (intramuscular fat)
Ideal Market Hog Quality (Packer response 1) Water holding capacity - Greatest economic loss to the industry - Dries excessively during cooking
Ideal Market Hog Quality (Packer response 2) Color - Important to consumers and japenesse market - Cannot be measured on kill floor ~ fab floor - Id becomes a problem
Quality Color Standards Unacceptable 1 4 2 3 Unacceptable 5
Ideal Market Hog Quality (Packer response 3) Tenderness - Many packers enhance product up to 30% to insure tenderness and juiciness
Ideal Market Hog Quality (Packer response 4) IMF (intramuscular fat) - Provides juiciness and flavor - Not as much of an issue with (enhanced pork) - Evaluated on a scale of 1-10
Marbling Scores Unacceptable 1 2 4 3 Unacceptable 5
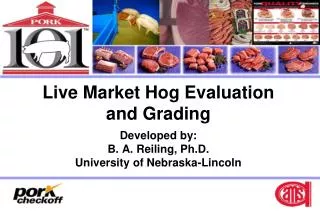
Market Hog Evaluation • Two methods to quantify Lean to fat 1) USDA Grade - Oldest used only to classify markets by some reporters 2) Percent Lean
Market Hog Evaluation USDA Yield Grade • Last rib back fat • Muscle score (1, 2, 3) (4 x last rib fat) – muscle score
Market Hog Evaluation • Percent Lean 1) Weight - 2) Fat measurement 10th rib Best indicator of total fat – Why? 3) Loin eye measurement - 10th rib - best indicator of total muscle Base Hog is 250 lbs, .80 BF, 5.0 LEA
Practice Comparisons 235 lbs
Practice Comparisons 285 lbs
Practice Comparisons 235 lbs 285 lbs DP .74 Last rib BF .3 Muscle score 2+ USDA Grade #1 10th rib BF .40 LEA 7.2 % Lean 58.5 DP .73 Last rib BF 1.9 Muscle score 2- USDA Grade #5.6 10th rib BF 1.8 LEA 3.8 % Lean 37.6
Practice Comparisons 245 lbs