Download
1 / 30
300 likes | 419 Views
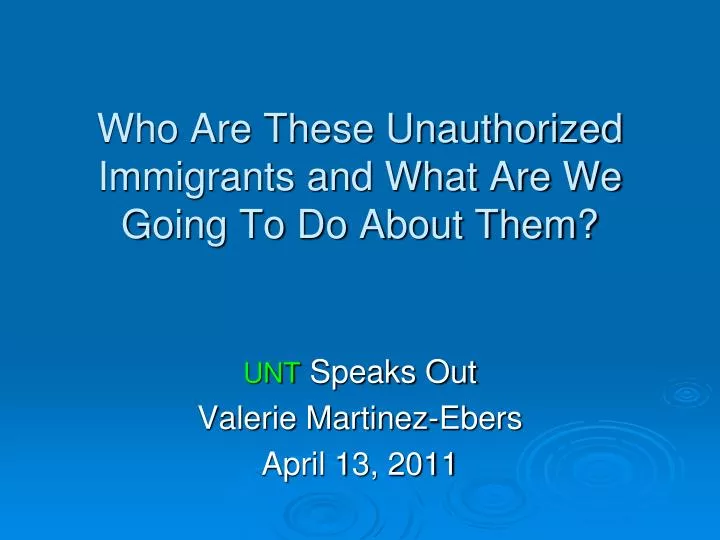
Who Are These Unauthorized Immigrants and What Are We Going To Do About Them?. UNT Speaks Out Valerie Martinez-Ebers April 13, 2011. Growing Diversity in the United States’ Population. National Population 308.745,538 Million Non-Hispanic Whites 63.7% Latinos 16.3%

E N D
Who Are These Unauthorized Immigrants and What Are We Going To Do About Them? • UNT Speaks Out • Valerie Martinez-Ebers • April 13, 2011
Growing Diversity in the United States’ Population • National Population 308.745,538 Million • Non-Hispanic Whites 63.7% • Latinos 16.3% • African Americans 12.6% • Asian 4.8% • Am Indians/Alaskan Native .9% • Native Hawaiian/Pacific Islander .2% • Two or More Races 2.9% • Change from 2000-2010 • National 9.7% • Non-Hispanic Whites 5.7% • Latinos 43.4% • Blacks/African Americans 12.3% • Asians 43.3% Source: U.S. Census Bureau, March 2011
The Foreign-born (Immigrants) are 12.5% of the total US population. Source: US Census Bureau, 2009 American Community Survey
Hispanic Births and Net Immigration by Decade: 1960-2030 Millions Source: Tienda and Mitchell Multiple Origins, Uncertain Destinies. 2006 Adapted from Figure 2-1.
Immigrant Patterns by Place of Origin, 1960-2009 Sources: U.S. Census Bureau, Decennial Censuses 1960 to 2000 and 2009 American Community Survey
The Status of the Foreign-Born Population Legal permanent residents Unauthorized immigrants 28.1% 31.4% Refugees and asylees .8% Non-immigrants 3.4% Naturalized citizens 37% Source: Adapted from Congressional Research Service, The US Foreign-Born Population Trends and Selected Characteristics,2009
Unauthorized Immigrants Are 3.7% of the entire US population and 5.1% of US workers. Source: US Census Bureau, 2009 American Community Survey
Unauthorized Immigrant Population, 2000-2009 Source: CPS (2000-2003); U.S. Department of Homeland Security (2004-2009)
Methods of Entrance • Admitted on valid non-immigrant visas but overstay or violate the terms of stay • Admitted based on fraudulent documents • Enter without inspection by crossing over SW or Northern US borders
Percentage of Unauthorized Immigrants by Country of Origin Source: Pew Hispanic Center estimates based on March CPS Supplements
A Profile of Immigrants to the US About two-thirds come from rural or poverty stricken areas of their home countries. Most see immigration as a tool for economic survival; they come to work or for education and many believe their stay in the US is temporary. Their rate of employment is slightly higher than US born. Most have more than one job. Source: Migration Policy Institute, Frequently Requested Statistics on Immigrants and immigration in the US, December 2010; Latino National Survey, 2006-2007
An Immigrant Profile (cont.) About half are Limited English Proficient Their level of education is bi-modal, many have less than a HS diploma (32%), however almost as many have college degrees (27%). About 50% are women; 13% are under 18 years of age; 22.5% are considered middle-class They have great affection and respect for the US and its citizens; they believe in “The American Dream.”* Source: Migration Policy Institute, Frequently Requested Statistics on Immigrants and immigration in the US, December 2010; Latino National Survey, 2006-2007; *Fraga et al, 2010
Unauthorized Distinctiveness • More are likely to be fleeing countries torn by civil war or governed by harsh military regimes; and yet are unable to obtain refugee or asylum status • Lower income and less educated
Recent Reform Proposals Increasing funding for border and interior security – to build more physical barriers and increase surveillance Increasing employer enforcement provisions Increasing the number of work visas Authorize local police officers to inquire about immigration status of people they stop, detain or arrest in enforcing existing state law Require immigrants to always carry on their person proof of immigration status An “earned” pathway to citizenship for “eligible” unauthorized persons DREAM Act
Public Attitudes towards Immigration • Attitudes towards immigration reflect current definitions of who “should” be members of the American polity • U.S. immigration policy has ebbed and flowed between openness and restriction • Not always related to economics or national security • Race or ethnicity (represented often as national origin) for most of our history has been the key determinant of inclusion • Many social scientists predict we are entering a new restrictive era
Public Opinion on Unauthorized Immigrants • Illegal Immigration was NOT a big issue in the US as recently as January 2006, ranking a distant 6th on the list of national issues, today it ranks 3 or 4 depending on the poll • When asked if they think illegal immigration is a serious problem, a growing majority of respondents say it is a very serious problem. (NY Times/CBS 2010) • Only 36% think the law passed in Arizona– which gives police the power to question someone they have already stopped, detained, or arrested about their legal status in the country, and requires people to produce documents verifying their status if asked – goes too far. (NY TimesI/CBS 2010) • Only 25% think the Arizona law will ease the undocumented problem in Arizona . (AP/Univision 2010)
More Public Opinion • 42% say the priority should be to tighten border security more strictly enforce immigration laws AND ALSO create a way for people here illegally to become citizens if they meet certain conditions (Pew 2010). • 39% favor and 57% oppose changing the Constitution to bar citizenship to children of undocumented (Pew 2010). • Three quarters think illegal immigrants are a drain on the economy because they do not all pay taxes but use public services like hospitals and schools, while 20% think immigrants strengthened the economy by providing low-cost labor and buying goods and services • 54 -70% support the DREAM Act (Gallup, New Focus 2010) • 32-65% favor limiting the number of legal immigrants entering the country (NY Times/CBS, Pew 2010).
Final Thoughts • The vast majority of Americans want comprehensive immigration reform NOT just policy that focuses on unauthorized immigration. • Currently, no such proposal is being considered by the Congress.
What Does It Mean To Be An “American”? • Cultural (Huntington 2004) • Anglo, protestant, English language • Hegemonic, assimilationist, non-repentent • Civic (Schlesinger 1992) • Commitment to democratic values of participation, tolerance, conflict resolution • Inclusive, pluralistic, evolutionary
One Legislative Approach • Sensenbrenner's HR 4437, The Border Protection,Antiterrorism, and Illegal Immigration Control Act of 2005, passed in House, 239-182 on Dec. 16, 2005 • Undocumented immigrants are felons with mandatory prison sentences • Criminalizes organizations/individuals assisting undocumented, punishable up to 5 years in prison • Increases fines on employers who hire undocumented, from $250-$10,000 to $5,000-$25,000) and repeat offenders are subject to felony charges • Grants state and local law enforcement agencies "inherent authority" to enforce immigration laws, no federal funding if they fail to enforce • Enhances border protection with a 700-mile double fence along Mexican border
U.S. Citizenship: 3 Definitions • Jus Soli: Citizens are born on U.S. soil. • Jus Sanguinis: Citizenship by the blood, if one parent is a U.S. citizen the child is considered a U.S. citizen. • Naturalized citizen: A resident for 5 years as a legal permanent resident *if you are married to a citizen, serving in the armed forces or an adoptee there are loopholes* • At least 18 years old • must be of good moral character • must be finger printed • must take an oath of renunciation of their country of origin and an oath of allegiance to the US • must be able to proficiently speak, read and write in English • must have a working knowledge of US History and Government • must pay all application fees and attend all interviews as required
Growing Diversity in the United States’ Population • National Population 308.745,538 Million • Non-Hispanic Whites 63.7% • Latinos 16.3% • African Americans 12.6% • Asian 4.8% • Am Indians/Alaskan Native .9% • Native Hawaiian/Pacific Islander .2% • Two or More Races 2.9% • Change from 2000-2010 • National 9.7% • Non-Hispanic Whites 5.7% • Latinos 43.4% • African Americans 12.3% • Asians 43.3% Source: U.S. Census Bureau, March 2011
Rates of Naturalization By Countries of Origin, 1995-2008 Source: US Census Bureau, American Community Survey Briefs, 2009
Example of Punitive Reform Sensenbrenner's HR 4437, The Border Protection,Antiterrorism, and Illegal Immigration Control Act of 2005, passed in House, 239-182 on Dec. 16, 2005 Undocumented immigrants are felons with mandatory prison sentences Criminalizes organizations/individuals assisting undocumented, punishable up to 5 years in prison Increases fines on employers who hire undocumented, from $250-$10,000 to $5,000-$25,000) and repeat offenders are subject to felony charges Grants state and local law enforcement agencies "inherent authority" to enforce immigration laws, no federal funding if they fail to enforce Enhances border protection with a 700-mile double fence along Mexican border
Federal DREAM Act Bi-partisan legislation introduced by Senators Hatch (R-UT) and Durbin (D-IL) in Fall 2010 Proposed law would have grant conditional legal status to children who were illegally brought to this country before age 15 but successfully graduate from high school and go on to complete at least 2 years of college or military service. As long as DREAMers maintain “good moral character” and remain in school and/or the military they are eligible for 6 years of Conditional Permanent Residency Did NOT include in-state tuition
Rates of Naturalization By Countries of Origin, 1995-2008 Source: US Census Bureau, American Community Survey Briefs, 2009
Example of Punitive Reform Sensenbrenner's HR 4437, The Border Protection,Antiterrorism, and Illegal Immigration Control Act of 2005, passed in House, 239-182 on Dec. 16, 2005 Undocumented immigrants are felons with mandatory prison sentences Criminalizes organizations/individuals assisting undocumented, punishable up to 5 years in prison Increases fines on employers who hire undocumented, from $250-$10,000 to $5,000-$25,000) and repeat offenders are subject to felony charges Grants state and local law enforcement agencies "inherent authority" to enforce immigration laws, no federal funding if they fail to enforce Enhances border protection with a 700-mile double fence along Mexican border
Public Reaction to HR. 4437 • Hundreds of thousands of immigrants and their supporters from LA to the DC Metro Mall, and dozens of cities in between, participated in protest demonstrations and marches • Counter demonstrations were much fewer and smaller but supporters of HR.4437 flooded their Congress members’ with letters, emails and phone calls
Immigrant Flow in 2009 TOTAL Immigrant Actions: 3,557,648 • Legal Permanent Residents 1,130,813 (31.8%) • Refugees 74,602 (2.1%) • Asylees 22,119 (.6%) • Naturalizations 743,715 (20.9%) • Unauthorized Residents located 613,003 (17.2%) • Unauthorized Residents deported 973,396 (27.3%) • Non-Immigrant Admissions: 162,600,000 Source: Department of Homeland Security, Office of Immigration Statistics, Policy Directorate, 2009 Yearbook of Immigration Statistics