Download
1 / 55
560 likes | 735 Views
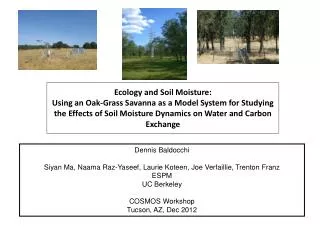
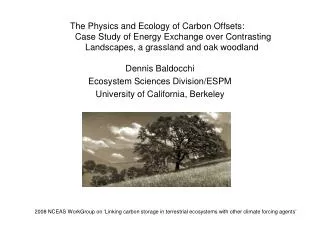
Using Biophysical Models and Eddy Covariance Measurements to Ask (and Answer) Questions About Biosphere-Atmosphere Interactions. Dennis Baldocchi Biometeorology Lab ESPM University of California, Berkeley. What is the State of the Atmosphere?.

E N D
Using Biophysical Models and Eddy Covariance Measurements to Ask (and Answer) Questions About Biosphere-Atmosphere Interactions Dennis Baldocchi Biometeorology Lab ESPM University of California, Berkeley
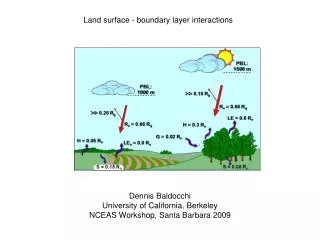
What is the State of the Atmosphere? Conservation of Mass, e.g. Solving the Bathtub Problem The ‘Level’ in a Tub depends on the Fluxes IN and OUT of the Tub
Trace Gas and Energy Fluxes between Land and the Atmosphere Isotopicexchange Courtesy of Jose Fuentes, UVa
Quantifying Sources and Sinks • Biology: • Leaf area density, a(z) • internal conc, Ci • stomatal resistance, rs • Physics: • Boundary layer resistance, rb • Scalar conc, C(z)
Controlling Processes and Linkages:Roles of Time and Space Scales
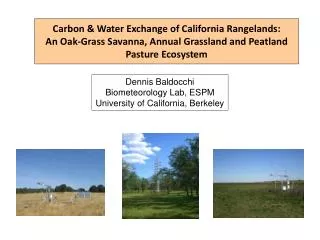
Eddy Covariance Technique • Oak Savanna • Annual Grassland • Peatland/Pasture • Temperate Deciduous Forest • Boreal Conifer Forest • Crops
Key Attributes of CanVeg • Seasonality • Leaf Area Index • Photosynthetic Capacity (Vcmax) • Model parameters based on Site Measurements and EcoPhysiological Rules and Scaling Functions • Stomatal Conductance scales with Photosynthesis • Jmax and Rd scale with Vcmax • Multilayer Framework • Computes Fluxes (non-linear functions) on the basis of a leaf’s local environment • Considers • Sun and Shade Leaf Fraction • Leaf Clumping • Leaf Inclination Angle • Non-local Turbulent Transport and Counter-Gradient Transfer
Models Must Consider Seasonality in Leaf Area Index and Photosynthetic Capacity, Vcmax Wilson et al. 2001 Tree Physiol ESPM 228, Advanced Topics in Micromet and Biomet
Can Principles from a Global Network Produce Insights about Global-Scale Fluxes? What is the Upper Bound of GPP and its Variability? Top-Down: GPP Scales with Energy Bottom-Up: Counting Productivity on leaves, plant by plant, species by species ESPM 111 Ecosystem Ecology
Potential and Real Rates of Gross Carbon Uptake by Vegetation: Most Locations Never Reach Upper Potential GPP at 2% efficiency and 365 day Growing Season tropics GPP at 2% efficiency and 182.5 day Growing Season FLUXNET 2007 Database
Upper-Bound on Global Gross Primary Productivity • Global GPP is ~ 120 * 1015gC y-1 • Solar Constant, S* (1366 W m-2) • Ave across disk of Earth S*/4 • Transmission of sunlight through the atmosphere (1-0.17=0.83) • Conversion of shortwave to visible sunlight (0.5) • Conversion of visible light from energy to photon flux density in moles of quanta (4.6/106) • Mean photosynthetic photon flux density, Qp • Fraction of absorbed Qp (1-0.1=0.9) • Photosynthetic efficiency, a (0.02) • Arable Land area (~ 100 * 1012 m2) • Length of daylight (12 hours * 60 minutes * 60 seconds = 43200 s/day) • Length of growing season (180 days) • Gram of carbon per mole (12) GPP = 1366*0.83*0.5*4.6*0.9*0.02*100*1012*43200*180*12/4=108*1015gC y-1 ESPM 111 Ecosystem Ecology
Interannual Variability in GPP is small, and not significantly different, across the Global Network
Little Change in Abiotic Drivers--annual Rg, ppt --across Network
Answering Questions with Models • Roles of Structure and Function • Leaf Angles and Clumping • Leaf Area Index • Photosynthetic Capacity • Phenology • Roles of Microclimate Conditions on Mass and Energy Exchange • Diffuse Light • Humidity • Temperature • Sub-Grid Parameterization, Energy Balance Closure and Scaling • Insights from a 2-D, ‘Wet’ DaisyWorld
Time Scales of Interannual Variability Baldocchi et al., 2001 Ecological Modeling
Role of Proper Model Abstraction ESPM 111 Ecosystem Ecology
How Long should one Measure Fluxes?:Decadal Power Spectrum of CO2 and Water Vapor Fluxes
Emergent Processes: Impact of Leaf Clumping on Canopy Light Response Curves
How Sensitive are Fluxes to Leaf Inclination Angle Distribution? ESPM 228 Adv Topics Micromet & Biomet
Carbon, Water and Sensible Heat Exchange scale with Photosynthetic Capacity ESPM 228 Adv Topics Micromet & Biomet
Leaf Size has a Modest Effect on Carbon & Water Exchange, But a Large Effect on Sensible Heat Exchange ESPM 228 Adv Topics Micromet & Biomet
Net Ecosystem Carbon Exchange scales with Growing Season Length Baldocchi et al, 2001 Ecological Modeling
Soil Temperature: An Objective Indicator of Phenology?? Baldocchi et al., 2005 Int J Biomet.
Soil Temperature: An Objective Measure of Phenology, part 2 Baldocchi et al. Int J. Biomet, 2005
Spatialize Phenology with Transformation Using Climate Map Baldocchi, White, Schwartz, unpublished
Flux Based Phenology Patterns with Match well with data from Phenology Network White, Baldocchi and Schwartz, unpublished
How do Sky Conditions Affect Net Carbon Exchange (NEE)?: Data Baldocchi, 1997 PCE Niyogi et al., GRL 2004
The ‘Diffuse-Light Enhancement’ is a function of LAI Knohl and Baldocchi, 2008 JGR Biogeosci
There are Trade-Offs between Reducing Light Amount (with Clouds and Aerosol) and Increasing Light Use Efficiency Knohl and Baldocchi, 2008 JGR Biogeosci
Canopy Photosynthesis and Aerosols: Impact on Daily & Annual Time Scales, II
Simple Model suggests A/T decreases with increasing D or Ci/Ca
Water Use Efficiency:Ci/Ca, Vapor Pressure Deficit and Diffuse Light Fraction But Complex feedbacks among Ci/Ca, humidity and diffuse light need to be considered! Knohl and Baldocchi, unpublished
In toto (considering coupled energy balance feedbacks) A/T increases with Ci/Ca
A/T, Stable Isotope Discrimination and Diffuse Light Knohl and Baldocchi, unpublished
Leaf Size and Extinction • Major Extinction at Triassic-Jurassic Boundary during period of Elevated Greenhouse effect • 4 fold increase in CO2 • 3 to 4 C temperature increase • 99% species turnover of megaflora with leaves > 5 cm • 10% species turnover of flora with leaves < 0.5 cm • Small Leaves are more effective in transferring heat and experiencing lethal surface temperatures McElwain et al Science, 1999 ESPM 111 Ecosystem Ecology
Why are Leaves Certain Sizes? Biophysics as an Evolutionary Filter Leaf Temperature and Leaf Morphology
Leaf size, CO2 and Temperature: Why are oak leaves smallin CA and large in TN?
Leaf Temperature and Isotopes? Helliker and Richter 2008 Nature