Download
1 / 7
70 likes | 176 Views
Early Rating Systems. The Crossleys , 1929 Archibald Crossley used random phone numbers to ask people which radio programs they listened to recall method – people surveyed recall what they heard previously

E N D
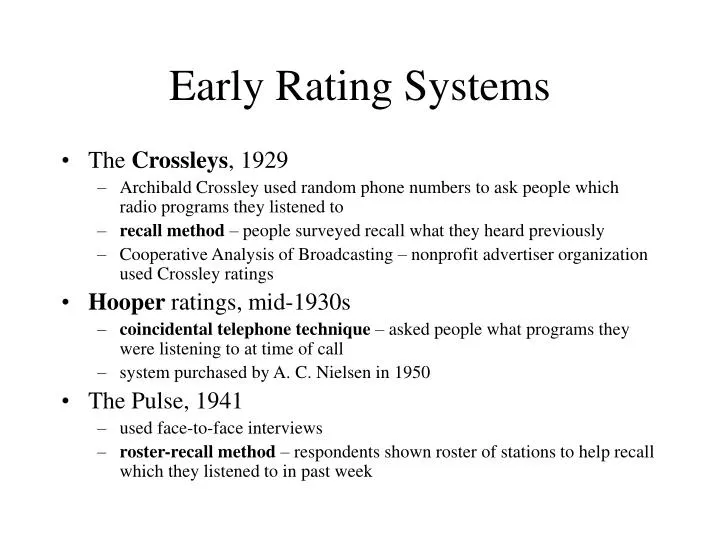
Early Rating Systems • The Crossleys, 1929 • Archibald Crossley used random phone numbers to ask people which radio programs they listened to • recall method – people surveyed recall what they heard previously • Cooperative Analysis of Broadcasting – nonprofit advertiser organization used Crossley ratings • Hooper ratings, mid-1930s • coincidental telephone technique – asked people what programs they were listening to at time of call • system purchased by A. C. Nielsen in 1950 • The Pulse, 1941 • used face-to-face interviews • roster-recall method – respondents shown roster of stations to help recall which they listened to in past week
Nielsen I • Conducted research for drug manufacturers, 1923 • Radio ratings • audimeter, 1936 – recorded which stations were tuned in on radios • National Radio Index, 1942 – sample of 1,000 homes • Television ratings • attached audimeter to TV sets in 1950 • by 1970, most connected to directly to central computer in Florida • some kept diaries to record which shows were watched by which members of family; recordimeter made sure diary entries were generally accurate • peoplemeter, 1987 – device that can record same information as audimeter and diaries • meters in development • active/passive meter – can determine whether people are in room • portable peoplemeter – pager-size device
Nielsen II • Information gathering techniques • random sampling – ideal households selected then chosen at random • usually multiple meters needed for each household • measuring base used to be households, but now individuals • attempts made to include out-of-home viewing • sample size now 50,000 households • Automated Measurement of Lineups, 1982 – keeps automated program schedule to determine which program is being watched • Analyzing information • Nielsen Television Index (NTI) – report on programs shown nationally • Nielsen Station Index (NSI), or sweeps – reports on local stations • country divided into more than 200 designated market areas (DMAs) • special reports – syndication, Hispanic viewing, VCR viewing, Internet
Arbitron • Measured TV and radio audiences, but dropped TV ratings in 1994 • Information gathering techniques • measures both metro survey area (MSA) and total survey area (TSA) • diaries sent to random sample of 1.3 million homes • printed reports sent to radio stations and advertisers • Purchased RADAR – system that tracks national radio programs with telephone recall method
Measurement Calculation • Rating • percentage of households watching TV program or listening to radio • considers total number of households owning TV set or radio • Share • also a percentage, but considers number of households with TV on • can total more than 100% as result of multiple sets in household • Gross average audience (GAA), or impressions – takes into account audience numbers if program is shown more than once in market • Average quarter-hour (AQ) – based on average number listening to station for at least 5 minutes during 15-minute period • Cume – number of different people who tune in over period of time • Percentages of people or households who have set tuned to anything • people using TV (PUT) and people using radio (PUR) • households using TV (HUT)
How Ratings Are Used • Selling advertising time – each prime time rating point worth about $30,000 • Advertisers use data to determine cost per thousand (CPM) and cost per point (CPP) • Determine overall health of industry • Basis of comparison – against competition and against the past • Programming decisions – programs rarely given chance to develop audience slowly
Other Forms of Feedback • Music preference research • sample usually taken from people already known to listen to station • phone or auditorium testing – researchers play music and ask participants prepared questions • focus groups – after hearing music, people discuss in small groups • Movies, TV programs, and commercials • pretesting – screening product before distribution • home testing on public access or UHF stations • Marketing Evaluation Inc. measures performer Q score for people and TVQ score for programs to determine popularity • Psychographics – lifestyle characteristics and how they relate to media preferences • Corporations and schools use effectiveness research